Further information#
What is the difference between the sample and the population variance and standard deviation?#
For a given set of \(N\) values \(x_1, x_2, \dots, x_N\) with mean \(\bar x\) the sample standard deviation is given by:
The sample variance is given by:
The population standard deviation is given by:
The population variance is given by:
The population standard deviation and/or variance should be used when the data set in question is for the entire population.
The sample standard deviation and/or variance should be used when the data set in question is a sample of the entire population. The modification in the calculation is to counteract a potential bias.
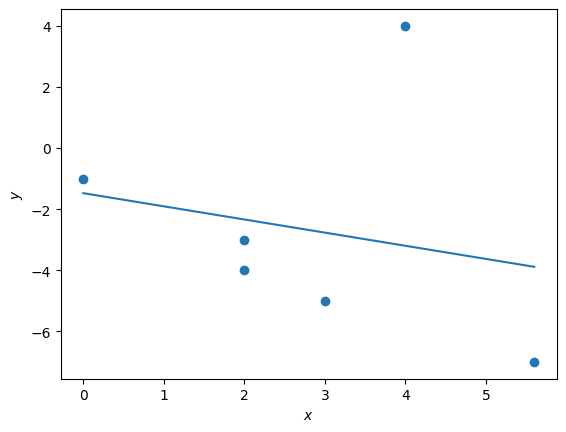
How to plot a line of best fit?#
The main library for plotting is called matplotlib and
Matplotlib covers this library in more detail.
However below is some code to plot the data and regression line for two collections of data:
import statistics as stat
import matplotlib.pyplot as plt

x = (0, 2, 2, 3, 4, 5.6)
y = (-1, -3, -4, -5, 4, -7)

slope, intercept = stat.linear_regression(x, y)

start_point, end_point = min(x), max(x)
image_start_point = slope * start_point + intercept
image_end_point = slope * end_point + intercept

plt.figure()
plt.scatter(x, y)
plt.plot((start_point, end_point), (image_start_point, image_end_point))
plt.xlabel("$x$")
plt.ylabel("$y$")
Text(0, 0.5, '$y$')
What other statistics tools exist in Python?#
The statsmodels library allows for a wider breadth of statistical analysis.
The scikit-learn library is arguably one of the most popular python libraries.
It is technically a library for machine learning and not statistics.
What is the difference between machine learning and statistics#
In a lot of cases the difference here is more question of vocabulary than actual tangible differences.
For example the scikit-learn library has a tool for linear regression
as does the statsmodels and the statistics library.
In practice statistics is often more descriptive, for example using linear regression to understand the relationship between two variables. Whereas machine learning is more predictive, for example using liner regression to predict one variable value from another.
A lot of modern applied mathematics uses tools such as neural networks which are considered to be from the field of machine learning.