
How to#
Calculate measures of spread and tendency#
Calculate a mean#
You can calculate the mean of a set of data using statistics.mean which takes an
iterable.
Usage
statistics.mean(data)
For example to calculate the mean of \((1, 5, 10, 12, 13, 20)\):
import statistics as st

data = (1, 5, 10, 12, 13, 20)
st.mean(data)
10.166666666666666
Calculate a median#
You can calculate the median of a set of data using statistics.median which takes an
iterable.
Usage
statistics.median(data)
For example to calculate the median of \((1, 5, 10, 12, 13, 20)\):
import statistics as st

data = (1, 5, 10, 12, 13, 20)
st.median(data)
11.0
Calculate the population standard deviation#
You can calculate the population standard deviation of a set of data using statistics.pstdev which takes an
iterable.
Usage
statistics.pstdev(data)
For example to calculate the population standard deviation of \((1, 5, 10, 12, 13, 20)\):
import statistics as st

data = (1, 5, 10, 12, 13, 20)
st.pstdev(data)
6.039223643997813
Calculate the sample standard deviation#
You can calculate the sample standard deviation of a set of data using statistics.stdev which takes an
iterable.
Usage
statistics.stdev(data)
For example to calculate the sample standard deviation of \((1, 5, 10, 12, 13, 20)\):
import statistics as st

data = (1, 5, 10, 12, 13, 20)
st.stdev(data)
6.6156380392723015
Calculate the population variance#
You can calculate the population variance of a set of data using statistics.pvariance which takes an
iterable.
Usage
statistics.pvariance(data)
For example to calculate the population variance of \((1, 5, 10, 12, 13, 20)\):
import statistics as st

data = (1, 5, 10, 12, 13, 20)
st.pvariance(data)
36.47222222222222
Calculate the sample variance#
You can calculate the sample variance of a set of data using statistics.variance which takes an
iterable.
Usage
statistics.variance(data)
For example to calculate the sample variance of \((1, 5, 10, 12, 13, 20)\):
import statistics as st

data = (1, 5, 10, 12, 13, 20)
st.variance(data)
43.766666666666666
Calculate the maximum#
You can calculate the maximum of a set of data use max which takes an iterable:
Usage
max(data)
For example to calculate the maximum of \((1, 5, 10, 12, 13, 20)\):
data = (1, 5, 10, 12, 13, 20)
max(data)
20
Calculate the minimum#
You can calculate the minimum of a set of data use max which takes an iterable:
Usage
min(data)
For example to calculate the minimum of \((1, 5, 10, 12, 13, 20)\):
data = (1, 5, 10, 12, 13, 20)
min(data)
1
Calculate quantiles#
To calculate cut points dividing data into \(n\) intervals of equal probability
you can use statistics.quantiles which takes an iterable and a number of
intervals.
Usage
statistics.quantiles(data, n)
For example to calculate the cut points that divide \((1, 5, 10, 12, 13, 20)\) in to 4 intervals of equal probability (in this case the quantiles are called quartiles):
import statistics as st

data = (1, 5, 10, 12, 13, 20)
st.quantiles(data, n=4)
[4.0, 11.0, 14.75]
Calculate the sample covariance#
To calculate the sample covariance of two data sets you can use
statistics.covariance which takes two iterables.
Usage
statistics.covariance(first_data_set, second_data_set)
For example to calculate the sample covariance of \(x=(1, 5, 10, 12, 13, 20)\) and \(y=(3, -3, 6, -2, 1, 2)\):
import statistics as st

x = (1, 5, 10, 12, 13, 20)
y = (3, -3, 6, -2, 1, 2)
st.covariance(x, y)
1.1666666666666667
Calculate the Pearson correlation coefficient#
To calculate the correlation coefficient of two data sets you can use
statistics.correlation which takes two iterables.
Usage
statistics.correlation(first_data_set, second_data_set)
For example to calculate the correlation coefficient of \(x=(1, 5, 10, 12, 13, 20)\) and \(y=(3, -3, 6, -2, 1, 2)\):
import statistics as st

x = (1, 5, 10, 12, 13, 20)
y = (3, -3, 6, -2, 1, 2)
st.correlation(x, y)
0.05325222181462784
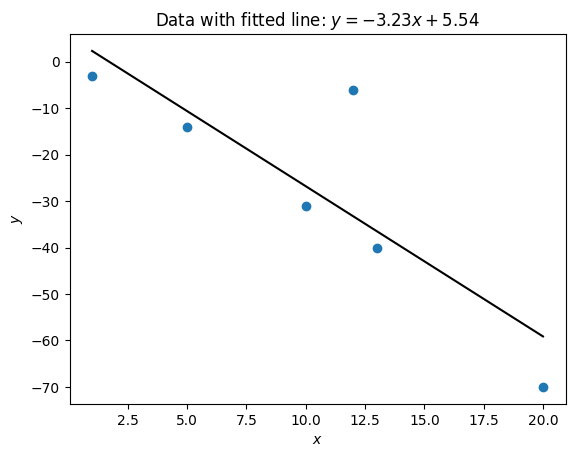
Fit a line of best fit#
To carry out linear regression to fit a line of best fit between two data sets
you can use statistics.linear_regression which takes two iterables and returns
a tuple with the slope and the intercept of the line.
Usage
statistics.linear_regression(first_data_set, second_data_set)
For example to calculate the correlation coefficient of \(x=(1, 5, 10, 12, 13, 20)\) and \(y=(-3, -14, -31, -6, -40, -70)\):
import statistics as st

x = (1, 5, 10, 12, 13, 20)
y = (-3, -14, -31, -6, -40, -70)
st.linear_regression(x, y)
LinearRegression(slope=-3.233815689261234, intercept=5.543792840822544)
Create an instance of the normal distribution#
A normal distribution with mean \(\mu\) and standard deviation \(\sigma\) can be
created using statistics.NormalDist:
Usage
statistics.NormalDist(mu, sigma)
For example to create the normal distribution with \(\mu=3\) and \(\sigma=.5\):
import statistics as st

distribution = st.NormalDist(mu=3, sigma=.5)
distribution
NormalDist(mu=3.0, sigma=0.5)
Use the cumulative distribution function of a normal distribution#
For an instance of a normal distribution with mean \(\mu\) and \(\sigma\), the
cumulative distribution function which gives \(F(x)=P(X<x)\) (the probability that
the normally distributed random variable is less than \(X\)) can be accessed using
statistics.NormaDist.cdf.
Usage
distribution = statistics.NormalDist(mu, sigma)
distribution.cdf(x)
For example to find the probability that \(X<2\) for a normally distributed random variable with \(\mu=3\) and \(\sigma=.5\):
import statistics as st

distribution = st.NormalDist(mu=3, sigma=.5)
distribution.cdf(2)
0.02275013194817922
Use the inverse cumulative distribution function of a normal distribution#
For an instance of a normal distribution with mean \(\mu\) and \(\sigma\), the
inverse cumulative distribution function which for a given \(p\) gives \(x\) such that \(p=P(X<x)\)
can be accessed using statistics.NormaDist.inv_cdf.
Usage
distribution = statistics.NormalDist(mu, sigma)
distribution.inv_cdf(p)
For example to find the value of \(X\) for which a normally distributed random variable with \(\mu=3\) and \(\sigma=.5\) will be less than with probability \(.7\).
import statistics as st

distribution = st.NormalDist(mu=3, sigma=.5)
distribution.inv_cdf(.7)
3.2622002563540202