
How#
How to draw a scatter plot#
We use the matplotlib.pyplot.scatter tool. This takes two iterables as
arguments: one for the first dimension and one for the other dimension.
Tip
import matplotlib.pyplot as plt

plt.figure()
plt.scatter(x, y)
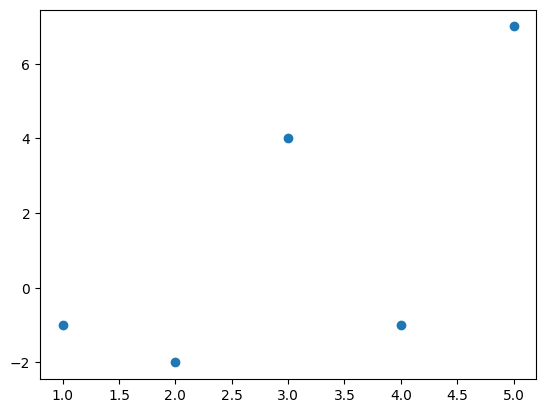
Here is an example:
import matplotlib.pyplot as plt
import numpy as np

x = np.array((1, 2, 3, 4, 5))
y = np.array((-1, -2, 4, -1, 7))
plt.figure()
plt.scatter(x, y);
How to plot a function#
We use the matplotlib.pyplot.plot tool. Similarly to
matplotlib.pyplot.scatter this takes two iterables. It plots a line plot. To
plot a function we use this an generate the required data.
Tip
import matplotlib.pyplot as plt

plt.figure()
plt.plot(x, y)
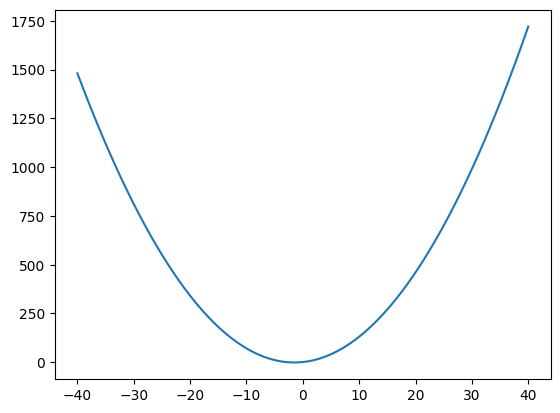
Here is an example of how we would plot \(f(x)=x ^ 2 + 3x + 1\):
import matplotlib.pyplot as plt
import numpy as np

x = np.linspace(-40, 40, 1000)
y = x ** 2 + 3 * x + 1
plt.figure()
plt.plot(x, y);
How to combine plots#
To combine plots they can be included one after the other after the
matplotlib.pyplot.figure call.
Tip
import matplotlib.pyplot as plt

plt.figure()
plt.plot(x, y)
plt.scatter(x, y)
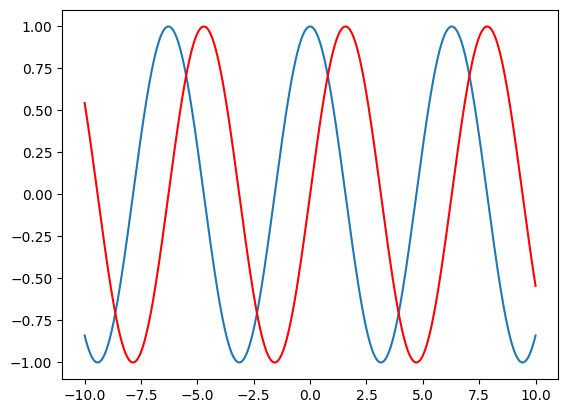
For example the following will draw two different functions \(f(x) = cos(x)\) and \(g(x)=sin(x)\) (we include an argument to plot \(g\) in red):
import matplotlib.pyplot as plt
import numpy as np

x = np.linspace(-10, 10, 1000)
f = np.cos(x)
g = np.sin(x)
plt.figure()
plt.plot(x, f)
plt.plot(x, g, color="red");
How to add a title#
To add a title we use matplotlib.pyplot.title which takes a string.
Tip
import matplotlib.pyplot as plt

plt.figure()
plt.title(label)
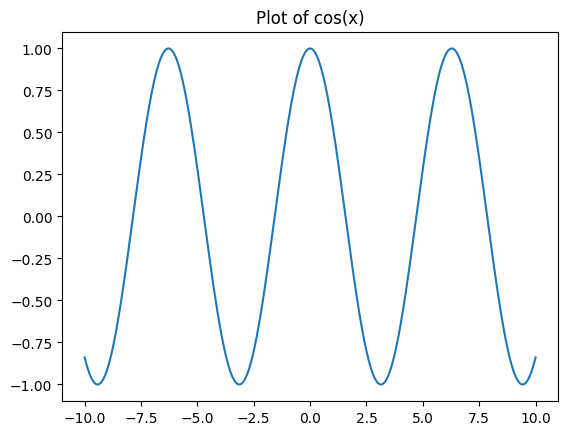
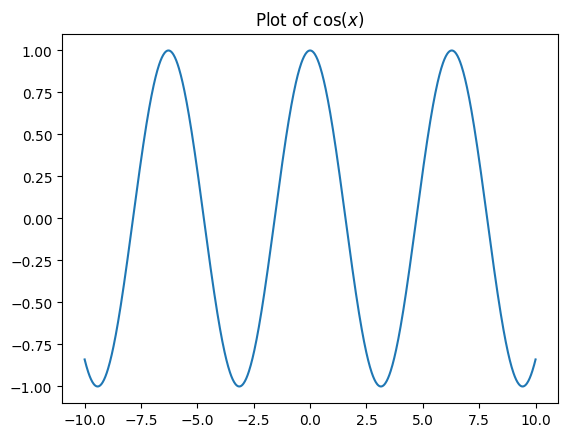
Here we add a title to a plot of \(cos(x)\):
import matplotlib.pyplot as plt
import numpy as np

x = np.linspace(-10, 10, 1000)
f = np.cos(x)
plt.figure()
plt.plot(x, f)
plt.title("Plot of cos(x)");
We can include LaTeX inside of $ signs to render mathematics:
import matplotlib.pyplot as plt
import numpy as np

x = np.linspace(-10, 10, 1000)
f = np.cos(x)
plt.figure()
plt.plot(x, f)
plt.title("Plot of $\cos(x)$");
<>:8: SyntaxWarning: "\c" is an invalid escape sequence. Such sequences will not work in the future. Did you mean "\\c"? A raw string is also an option.
<>:8: SyntaxWarning: "\c" is an invalid escape sequence. Such sequences will not work in the future. Did you mean "\\c"? A raw string is also an option.
/tmp/ipykernel_2849/3417791808.py:8: SyntaxWarning: "\c" is an invalid escape sequence. Such sequences will not work in the future. Did you mean "\\c"? A raw string is also an option.
  plt.title("Plot of $\cos(x)$");
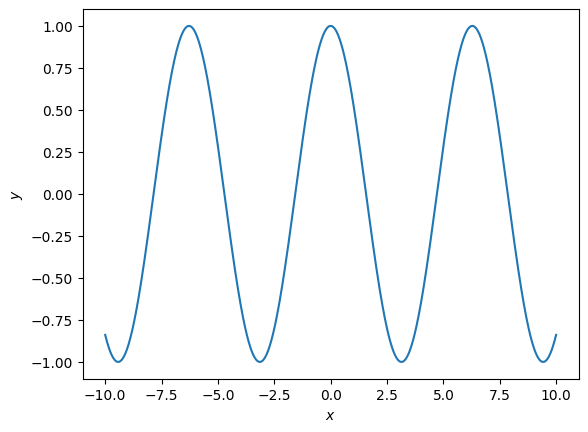
How to add axes labels#
To add labels we use matplotlib.pyplot.xlabel or matplotlib.pyplot.ylabel.
These both take a string.
Tip
import matplotlib.pyplot as plt

plt.figure()
plt.xlabel(label)
plt.ylabel(label)
Here is an example:
import matplotlib.pyplot as plt
import numpy as np

x = np.linspace(-10, 10, 1000)
f = np.cos(x)
plt.figure()
plt.plot(x, f)
plt.xlabel("$x$")
plt.ylabel("$y$");
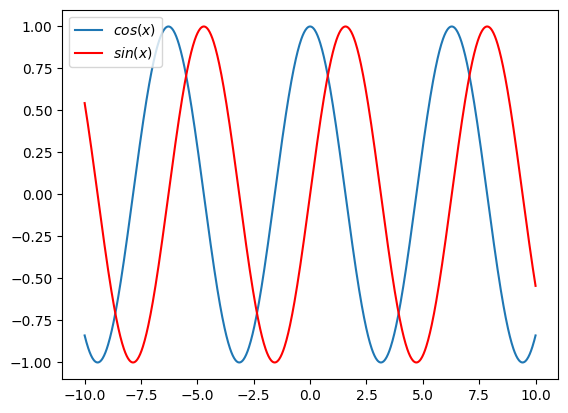
How to add a legend#
When plotting multiple plots it can be helpful to include a legend. We do this
by passing a label to the specific plot as a string. The legend then also need
to be specified, that is done with matpltlib.pyplot.legend.
Tip
import matplotlib.pyplot as plt

plt.figure()
plt.scatter(x, y, label)
plt.legend()
import matplotlib.pyplot as plt
import numpy as np

x = np.linspace(-10, 10, 1000)
f = np.cos(x)
g = np.sin(x)
plt.figure()
plt.plot(x, f, label="$cos(x)$")
plt.plot(x, g, label="$sin(x)$", color="red")
plt.legend();
How to save a plot#
To save a plot to file we use the matplotlib.pyplot.savefig tool that takes a
string as an argument for the name of the file.
Tip
import matplotlib.pyplot as plt

plt.figure()
plt.scatter(x, y, label)
plt.savefig(fname)
fname is a string that represents the name of the file.
import matplotlib.pyplot as plt
import numpy as np

x = np.linspace(-10, 10, 1000)
f = np.cos(x)
g = np.sin(x)
plt.figure()
plt.plot(x, f, label="$cos(x)$")
plt.plot(x, g, label="$sin(x)$", color="red")
plt.legend();
Tip
import matplotlib.pyplot as plt

plt.figure()
plt.scatter(x, y, label)
plt.legend()
import matplotlib.pyplot as plt
import numpy as np

x = np.array((1, 2, 3, 4, 5))
y = np.array((-1, -2, 4, -1, 7))
plt.figure()
plt.scatter(x, y)
plt.savefig("plot.pdf")
You can pass various extensions as the name of the file (.pdf, png, .svg).
This specifies the format of the file. In general .pdf is the format of the
file that ensures the highest quality.