
Further information#
How can you plot a function#
It is possible to plot a function using sympy using the sympy.plot
function:
Usage
sympy.plot(expression)
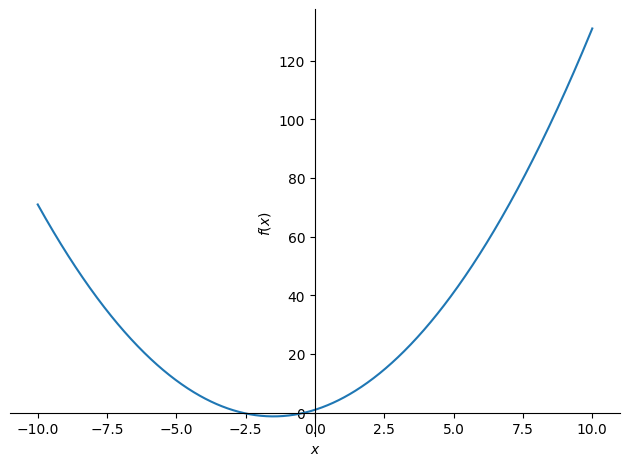
So for example, here is a plot of \(f(x)=x^2 + 3x + 1\):
import sympy as sym

x = sym.Symbol("x")
sym.plot(x ** 2 + 3 * x + 1)
<sympy.plotting.backends.matplotlibbackend.matplotlib.MatplotlibBackend at 0x7f81de339160>
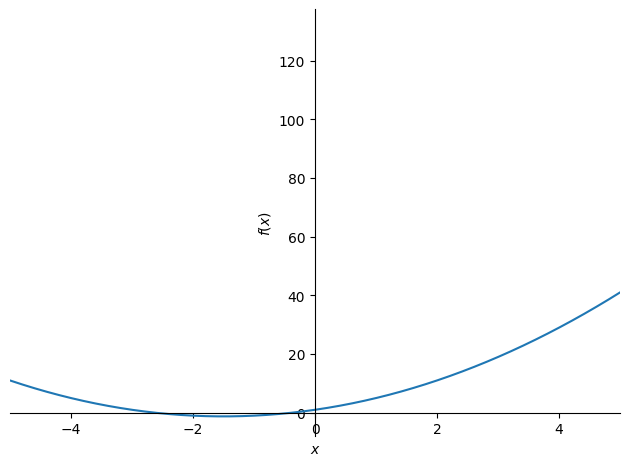
It is possible to specify the \(x\) and combine it with other plots:
sym.plot(x ** 2 + 3 * x + 1, xlim=(-5, 5))
<sympy.plotting.backends.matplotlibbackend.matplotlib.MatplotlibBackend at 0x7f81d04ccf50>
This plotting solution is good if you want to take a look at a function
quickly but it is not recommended. The main python library for plotting is called
matplotlib and is covered in Matplotlib.
Here is the
sympydocumentation for plotting: https://docs.sympy.org/latest/modules/plotting.htmlHere is the official
matplotlibdocumentation: https://matplotlib.org