Grey scale network graph colorings in Sage
This is a quick post following a request for some Sage help that a colleague asked for. It’s based on a quick fix and I’m wondering if someone might come up with a better way of doing this that I’ve missed or if it’s worth actually raising a ticket to incorporate something like it in Sage.
So my colleague is writing a book on Graph theory and recently started taking a look at Sage’s capacity to handle Graph theory stuff and colorings in particular. The issue was that said colleague ideally wanted grey scale pictures of the colorings (I’m guessing this is due to the publisher or something - I didn’t ask).
The following creates a bespoke graph and plots a coloring (ensures that adjacent vertices have different colors):
sage: P = graphs.PetersenGraph()
sage: c = P.coloring()
sage: c
[[1, 3, 5, 9], [0, 2, 6], [4, 7, 8]]
sage: P.show(partition=c)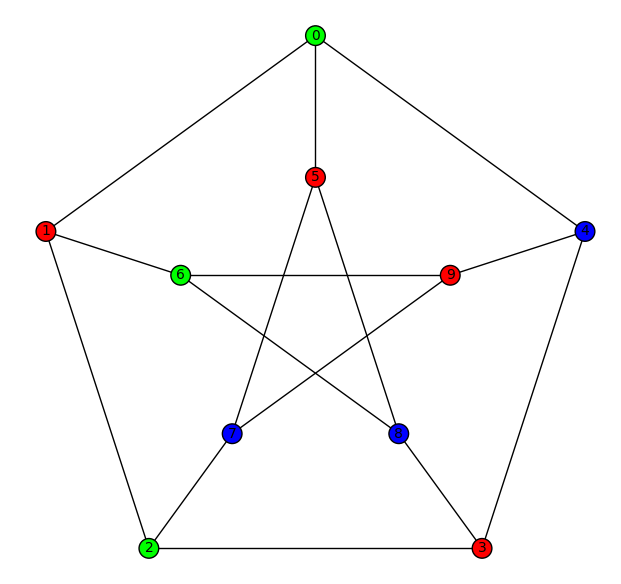
Now to get that in to grey scale we could of course open up inkscape or something similar and convert it but it would be nice to be able to directly use something like the matplotlib grey scale color map.
This is in fact what I started to look for but with no success so I then started to look for how one converts an RGB tuple (3 floats corresponding to the makeup of a color) to something on a grey scale.
Turns out (see this stackoverflow question which leads to this wiki page), that for \(\text{rgb}=(r,g,b)\), the corresponding grey scale color is given by \(\text{grey}=(Y,Y,Y)\) where \(Y\) is given by:
where \(y\) is given by:
I genuinely have no understanding what so ever as to what that does but the idea is to make use of the Sage rainbow function which returns a given number of colors (very useful for creating plots when you don’t necessarily want to come up with all the color names).
sage: rainbow(10, 'rgbtuple')
[(1.0, 0.0, 0.0),
 (1.0, 0.6000000000000001, 0.0),
 (0.7999999999999998, 1.0, 0.0),
 (0.20000000000000018, 1.0, 0.0),
 (0.0, 1.0, 0.40000000000000036),
 (0.0, 1.0, 1.0),
 (0.0, 0.40000000000000036, 1.0),
 (0.1999999999999993, 0.0, 1.0),
 (0.8000000000000007, 0.0, 1.0),
 (1.0, 0.0, 0.5999999999999996)]
So here’s a function that takes the output of rainbow and maps it to grey scale:
def grey_rainbow(n, black=False):
    """
    Return n greyscale colors
    """
    if black:
        clrs = [0.299*clr[0] + 0.587 * clr[1] + 0.114 * clr[2] for clr in rainbow(n-2,'rgbtuple')]
    else:
        clrs = [0.299*clr[0] + 0.587 * clr[1] + 0.114 * clr[2] for clr in rainbow(n-1,'rgbtuple')]
    output = ['white']
    for c in clrs:
        if c <= 0.0031308:
            rgb = 12.92 * c
        else:
            rgb = (1.055*c^(1/2.4)-0.055)
        output.append((rgb,rgb,rgb))
    if black:
        output.append('black')
    return output
Note that we’re including the option to use black as one of the colours or not (it covers up the vertex labels on the corresponding plot if we do). We can then use that function to create our own partition coloring:
def grey_coloring(G, black=False):
    chromatic_nbr = G.chromatic_number()
    coloring = G.coloring()
    grey_colors = grey_rainbow(chromatic_nbr, black)
    d = {}
    for i, c in enumerate(grey_colors):
        d[c] = coloring[i]
    return P.graphplot(vertex_colors=d)
Here is how we can simply use the above to get a grey scale coloring of a graph:
P = graphs.PetersenGraph()
p = grey_coloring(P)
p.show()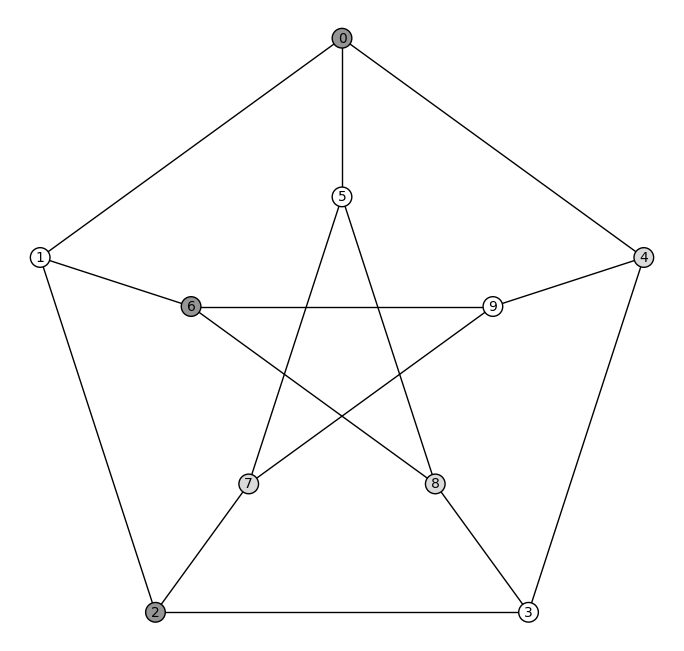
P = graphs.PetersenGraph()
p = grey_coloring(P,black=True)
p.show()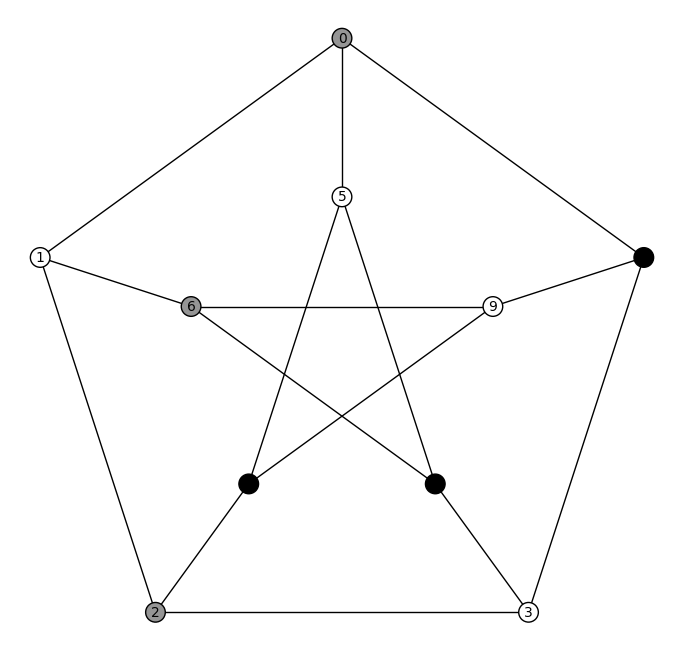
Now what would be really nice would be to be able to just use any matplotlib color map in the Graph coloring.
This might actually already be possible, I’ll fish through the Sage source code at some point and take a look (the awesome thing about Sage is that I can do that).
Otherwise, it might just be a quick fix (and hopefully a less hacky one then above - I still laugh at the formulae I use and that seems to work), who nows I might even see if it’s worth opening an actual ticket for this.