Getting started
In this tutorial, you will mark a small piece of assessment from scratch. There are three students and two criteria; by the end you will have individual feedback files, a cohort summary, and a set of summary charts.
Install scholia
Assuming you have uv installed: install scholia and its dependencies:
Initialise the marking directory
Create the scholia/ directory and its two starting files:
This produces:
scheme.yaml is initially empty. students.csv contains only the
header row student_id.
Write the marking scheme
Open scholia/scheme.yaml and define the criteria and categories.
This tutorial uses two criteria, each with three possible outcomes:
q1(a):
  a:
    marks: 0
    feedback: "Did not attempt the question."
  b:
    marks: 8
    feedback: "Correct and well-presented solution."
  c:
    marks: 6
    feedback: "Correct method but the final calculation contains an error."

q1(b):
  a:
    marks: 0
    feedback: "Did not attempt the question."
  b:
    marks: 10
    feedback: "Correct and well-presented solution."
  c:
    marks: 7
    feedback: "Correct method but missing the boundary case."
Sync the criterion headers
Run:
Scholia reads the criterion names from scheme.yaml and adds the
corresponding columns to students.csv, sorted alphabetically:
Add the students
Open scholia/students.csv and append a row for each student,
leaving the category columns blank for now:
Mark each student
Fill in the category label for each student and criterion by editing the CSV directly:
Generate feedback and summary
Once categories have been assigned for every student and criterion, run:
Scholia writes:
scholia/feedback/s001.md,s002.md,s003.md: individual feedback files.scholia/marks.csv: student IDs and total marks.scholia/summary.md: cohort statistics.scholia/assets/: summary charts.
Inspecting the marks CSV
Students who have not been fully marked appear with an empty
total_marks cell.
Inspecting a feedback file
# Feedback: s001

**Total marks:** 18

## Criterion breakdown

### q1(a)

**Marks:** 8

Correct and well-presented solution.

### q1(b)

**Marks:** 10

Correct and well-presented solution.
Inspecting the summary
# Marking summary
| Statistic | Value |
| --------- | ----- |
| Count | 3 |
| Mean | 10.33 |
| Std dev | 6.66 |
| Min | 6 |
| Q1 (25%) | 6.50 |
| Median | 7.00 |
| Q3 (75%) | 12.50 |
| Max | 18 |
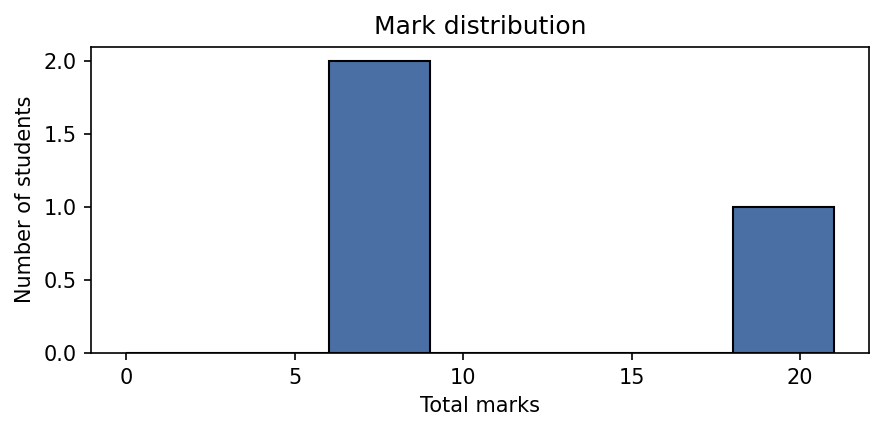
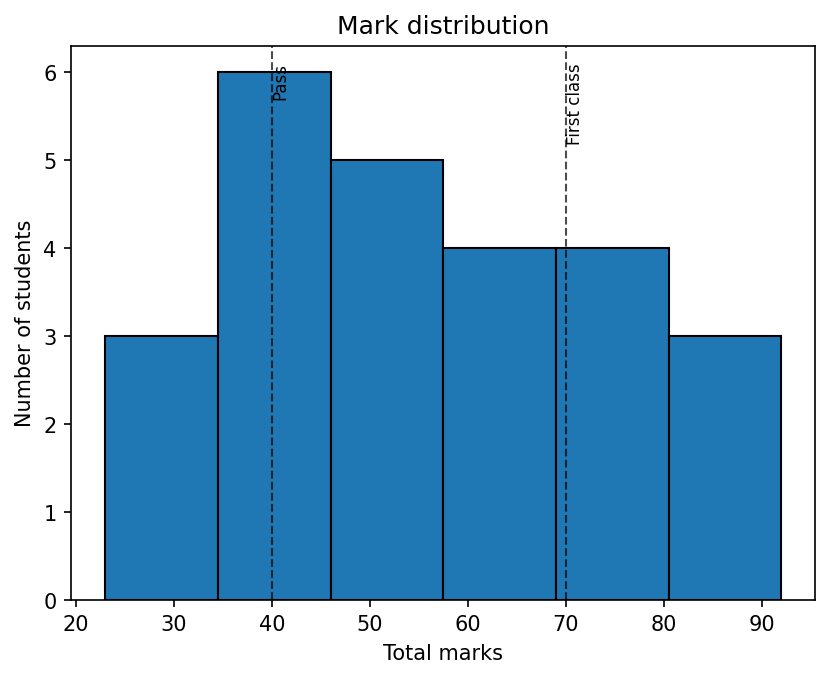
## Mark distribution

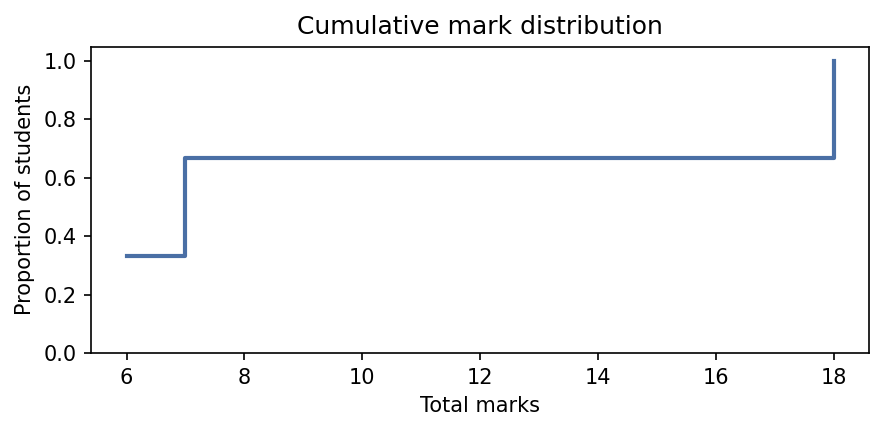
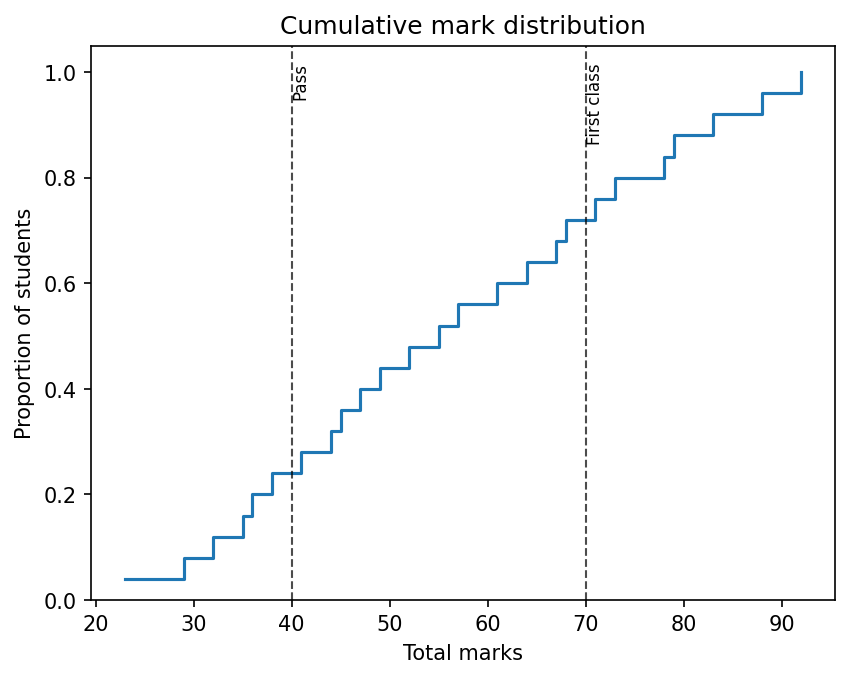
## Cumulative mark distribution

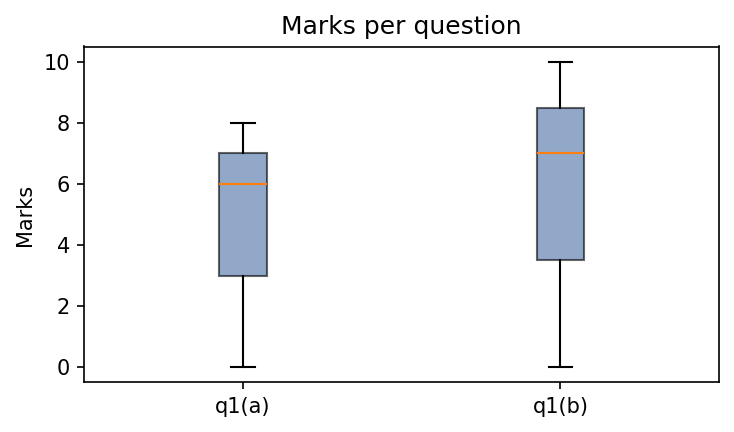
## Marks per criterion

## Criterion mark correlations

## Per-criterion breakdown
### q1(a)
- Did not attempt the question: 1 student(s) (0 marks)
- Correct and well-presented solution: 1 student(s) (8 marks)
- Correct method but the final calculation contains an error: 1 student(s) (6 marks)
### q1(b)
- Did not attempt the question: 1 student(s) (0 marks)
- Correct and well-presented solution: 1 student(s) (10 marks)
- Correct method but missing the boundary case: 1 student(s) (7 marks)
The charts referenced above are saved in scholia/assets/. For this
cohort of three students they look like this.
Mark distribution (distribution.png):
Cumulative mark distribution (cumulative.png):
Marks per criterion (boxplot.png):
Criterion mark correlations (correlation.png):
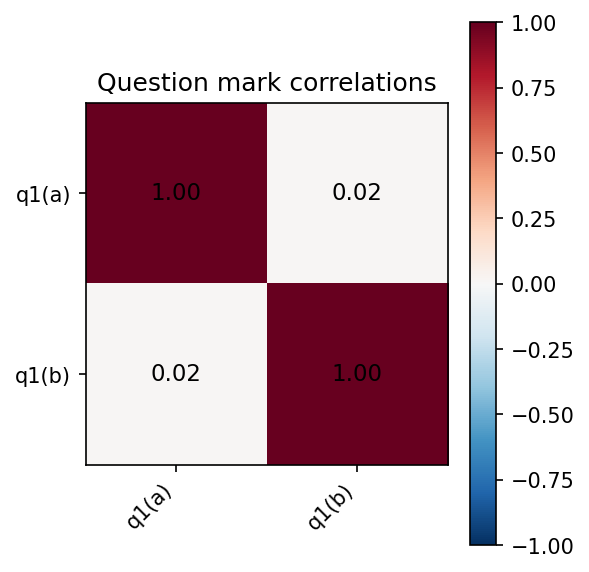
With only three students the correlation is not statistically meaningful, but with a full cohort it shows whether students who scored well on one criterion tended to score well on others.
Adding grade bands (optional)
Grade bands are entirely optional. If your institution has grade
boundaries, add a bands key to scheme.yaml before running
scholia mark. Omitting it leaves all output unchanged.
bands:
  - name: Fail
    min: 0
  - name: Pass
    min: 40
  - name: First class
    min: 70

q1(a):
  a:
    marks: 0
    feedback: "Did not attempt the question."
  ...
Each entry names a band and gives its inclusive lower threshold. With
bands defined, scholia mark adds two things to the output.
Grade-band table in summary.md. A breakdown of how many
students fall in each band appears after the summary statistics:
## Grade bands

| Band        | Range | Students | %     |
| ----------- | ----- | -------- | ----- |
| Fail        | 0–39  | 3        | 15.0% |
| Pass        | 40–69 | 12       | 60.0% |
| First class | ≥ 70  | 5        | 25.0% |
Dashed lines on the distribution and cumulative charts. A vertical dashed line labelled with the band name is drawn at each threshold, making it easy to see where the cohort sits relative to the grade boundaries.
Mark distribution with bands:
Cumulative mark distribution with bands:
Adjusting the scheme
Suppose category c in q1(a) should be worth 5 marks rather than 6.
Edit scheme.yaml:
Re-run scholia mark. All feedback files and the summary are
regenerated automatically from the updated scheme and the unchanged
student assignments. No student record needs editing.
This is the central design of scholia: categories decouple the act of marking from the numeric mark, so adjustments propagate instantly across the whole cohort.