Are dogs appreciated fairly on @dog_rates?
The best account on twitter is @dog_rates. This account offers a fundamentally important service by providing expert rating of dogs. In this blog post I am going to examine their tweets and try to make sure that all dogs are appreciated appropriately by followers of the account. This is important, by using some statistical techniques (for the purposes of being fancy I could choose to call linear regression: machine learning) I will check that the number of likes and retweets a dog gets isn’t influenced by the rating chosen by @dog_rates because after all: they are good dogs Brunt.
Here is an example of one of their tweets:
This is Armas. He is king of the frosty head tilts. Flawlessly executed sneaky tongue slip as well. 13/10 simply breathtaking pic.twitter.com/ysuI48Co7A
— WeRateDogs™ (@dog_rates) March 20, 2018
I’m sure you would agree: Armas is a very good dog and he has gotten a high number of likes and retweets but is 13/10 influencing that? Is 13 indeed the correct score? Would a more accurate score (perhaps 12? perhaps 14?) have made him get more likes and retweets (the “cuddles” of the twitter world)?
I in no way intend to offer any doubt as to the expertise of @dog_rates but I will analyse things and hopefully confirm that they’re doing an excellent job.
(Spoiler: don’t worry all the dogs are rated h*ckin well.)
There are essentially 2 steps to this analysis:
- Collecting the data;
- Carrying out a number of statistical measuring techniques.
I will do all of this using the python programming language which is one of the most popular programming tools for scientific research. (Important scientific research like evaluating @dog_rates.
If you would like the source code for the analysis you can find it here: github.com/drvinceknight/DataScienceingDogRates
The data
The raw data looks something like:
               created_at                                          full_text  like_count  retweet_count
3219  2017-02-20 00:53:27  This is Poppy. She just arrived. 13/10 would s...       16007           2296
3218  2017-02-20 04:41:25                     @JenLiaLongo :,) @GoodDogsGame          14              0
3217  2017-02-20 17:00:04  This is Bronte. She's fairly h*ckin aerodynami...       22256           3565
Using a bit of regular expressions I also get:
score: the score given to the doggo;scale: the scale for the score (usually 10);full_text_len: how long the tweet was.
As you can see in the sample of data there, I am collecting the replies and various other pieces of data but for my work I need to only include true ratings of doggos. So I reject any tweet that doesn’t follow these rules:
- The
scoreis between 0 and 20; - The
scaleis 10; - The full text of the tweet doesn’t start with a
RTor a@.
Now we are ready to analyse things
The relationship between likes and retweets
Let us start by looking at the relationship between likes and retweets of each tweet.
Here is a plot showing the relationship between the log of these two counts:
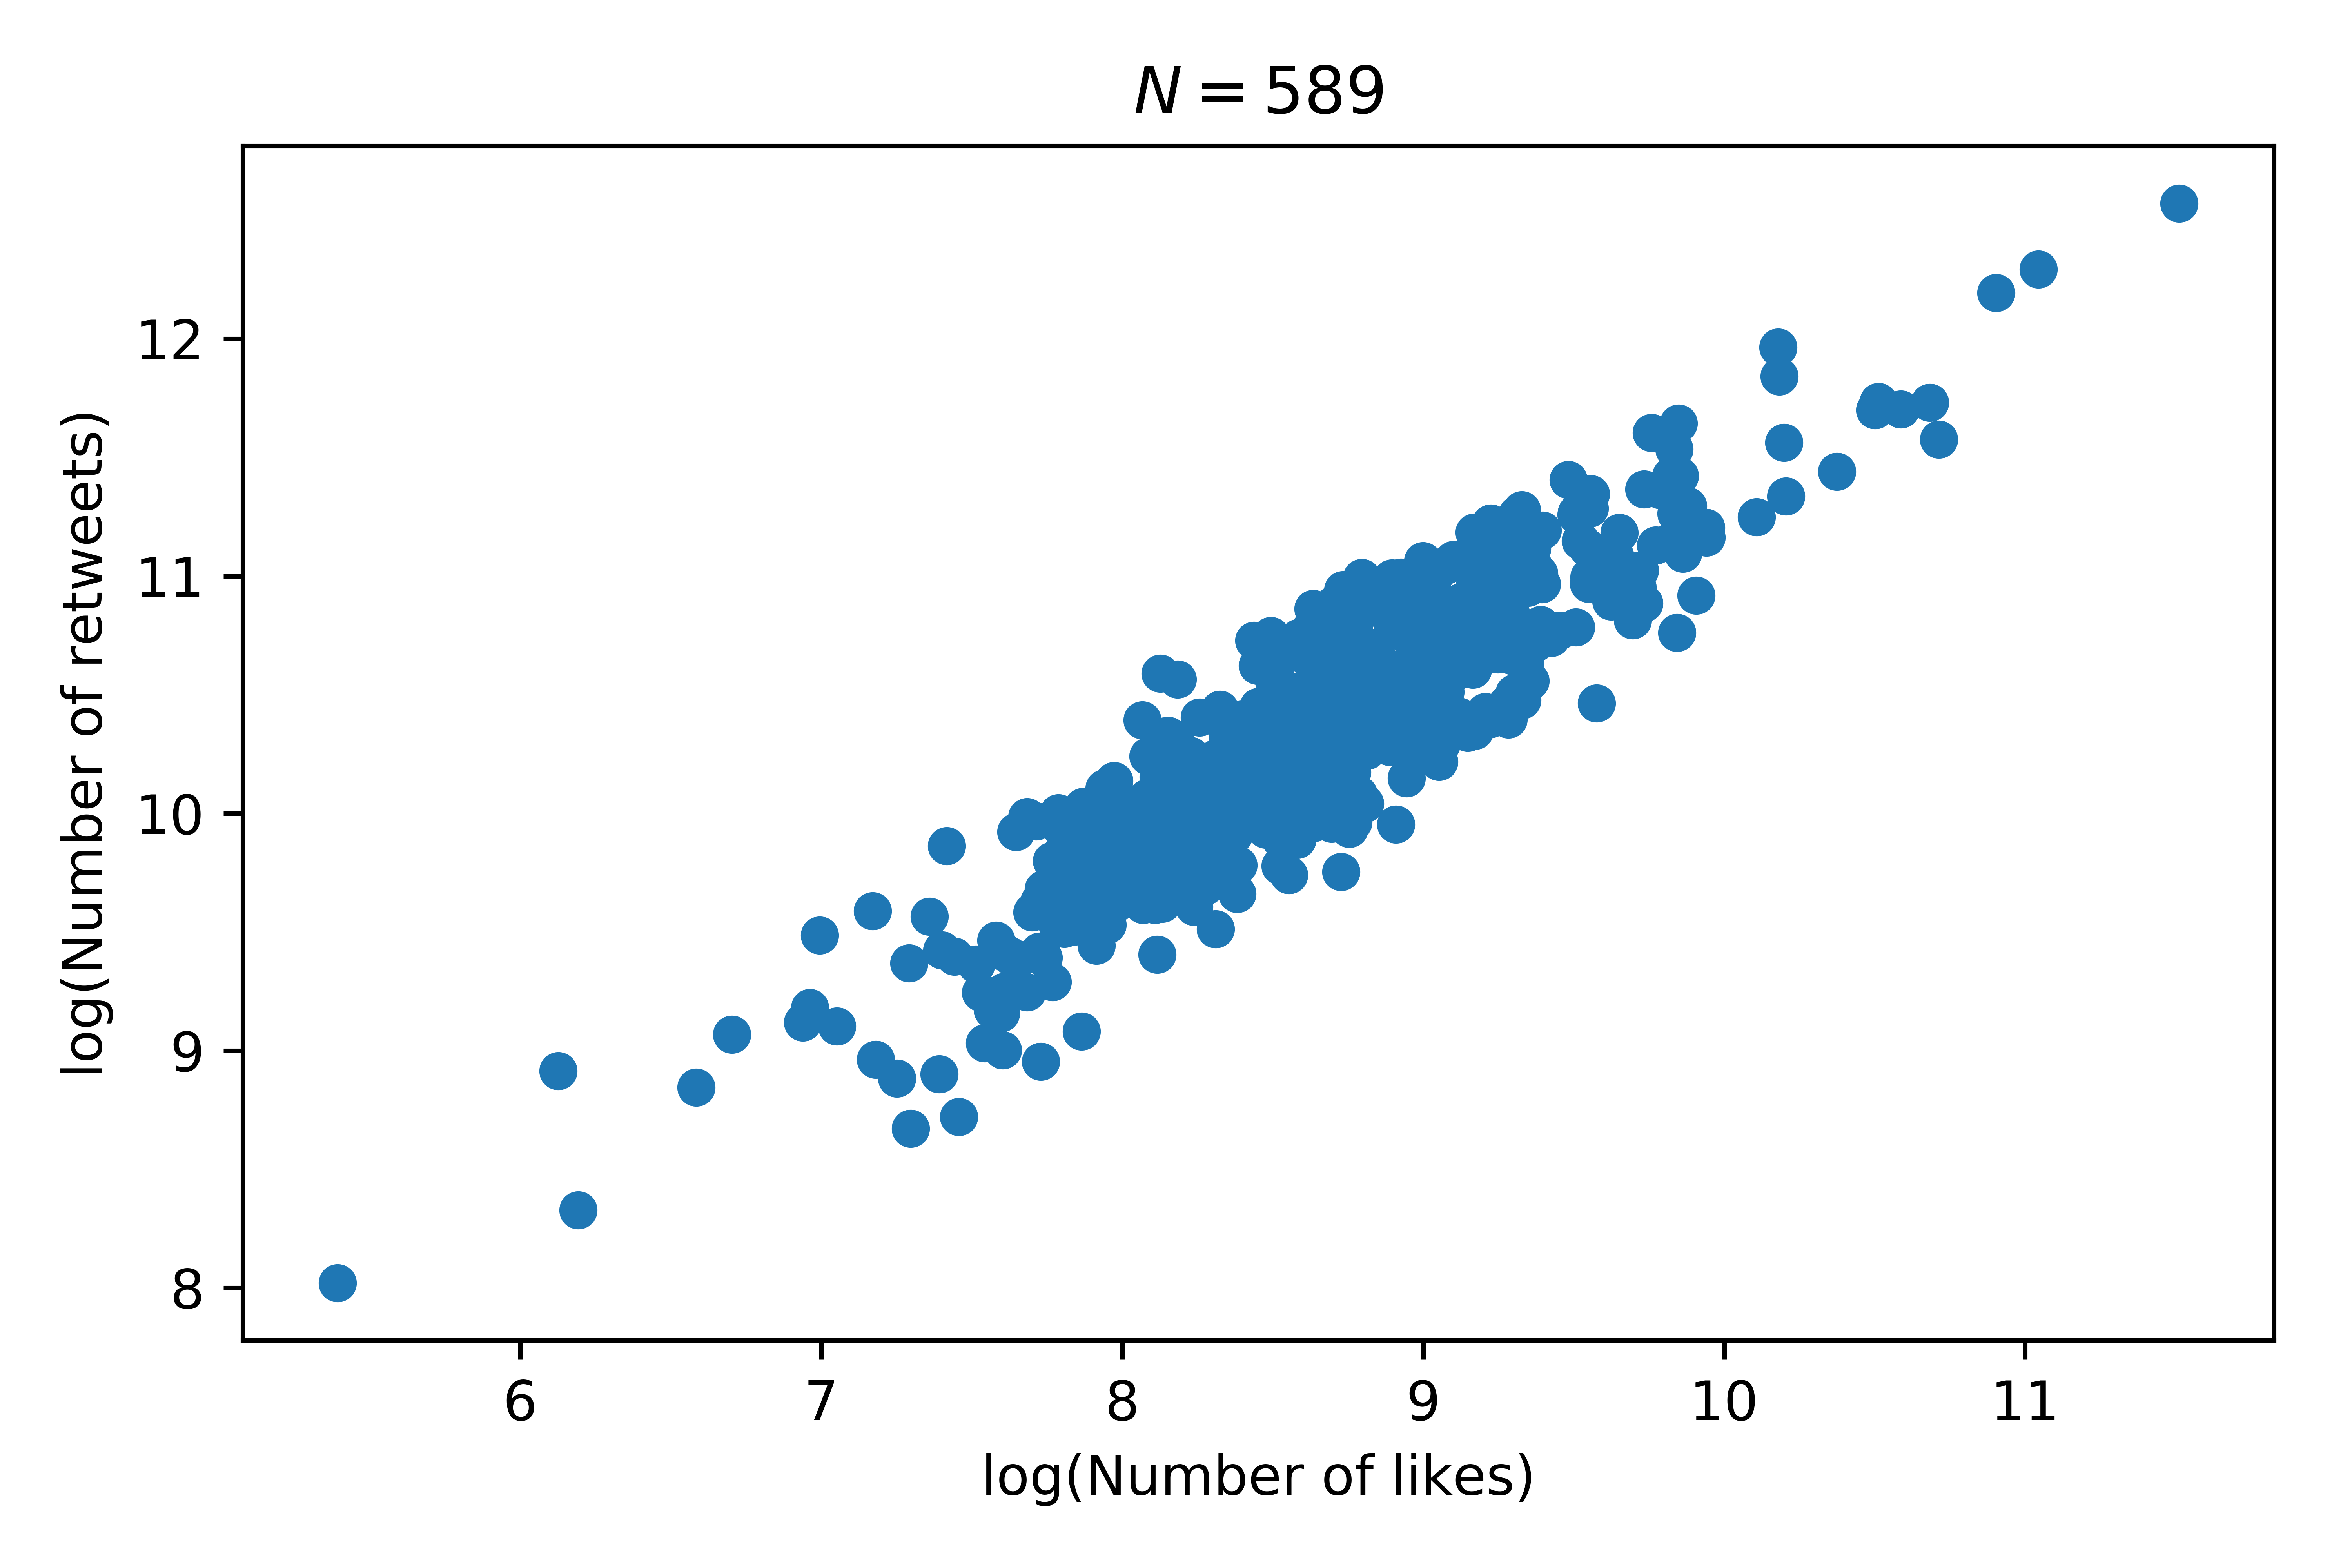
That looks like a pretty linear relationship and indeed if we fit a linear regression model to this we obtain an \(R^2\) value of \(0.817\) with a \(p\)value less than \(10^{-3}\). This implies that there’s a pretty good relationship between the number of retweets (\(X\)) and likes (\(Y\)) on a given tweet:
which can be simplified to give:
Here is this specific relationship:
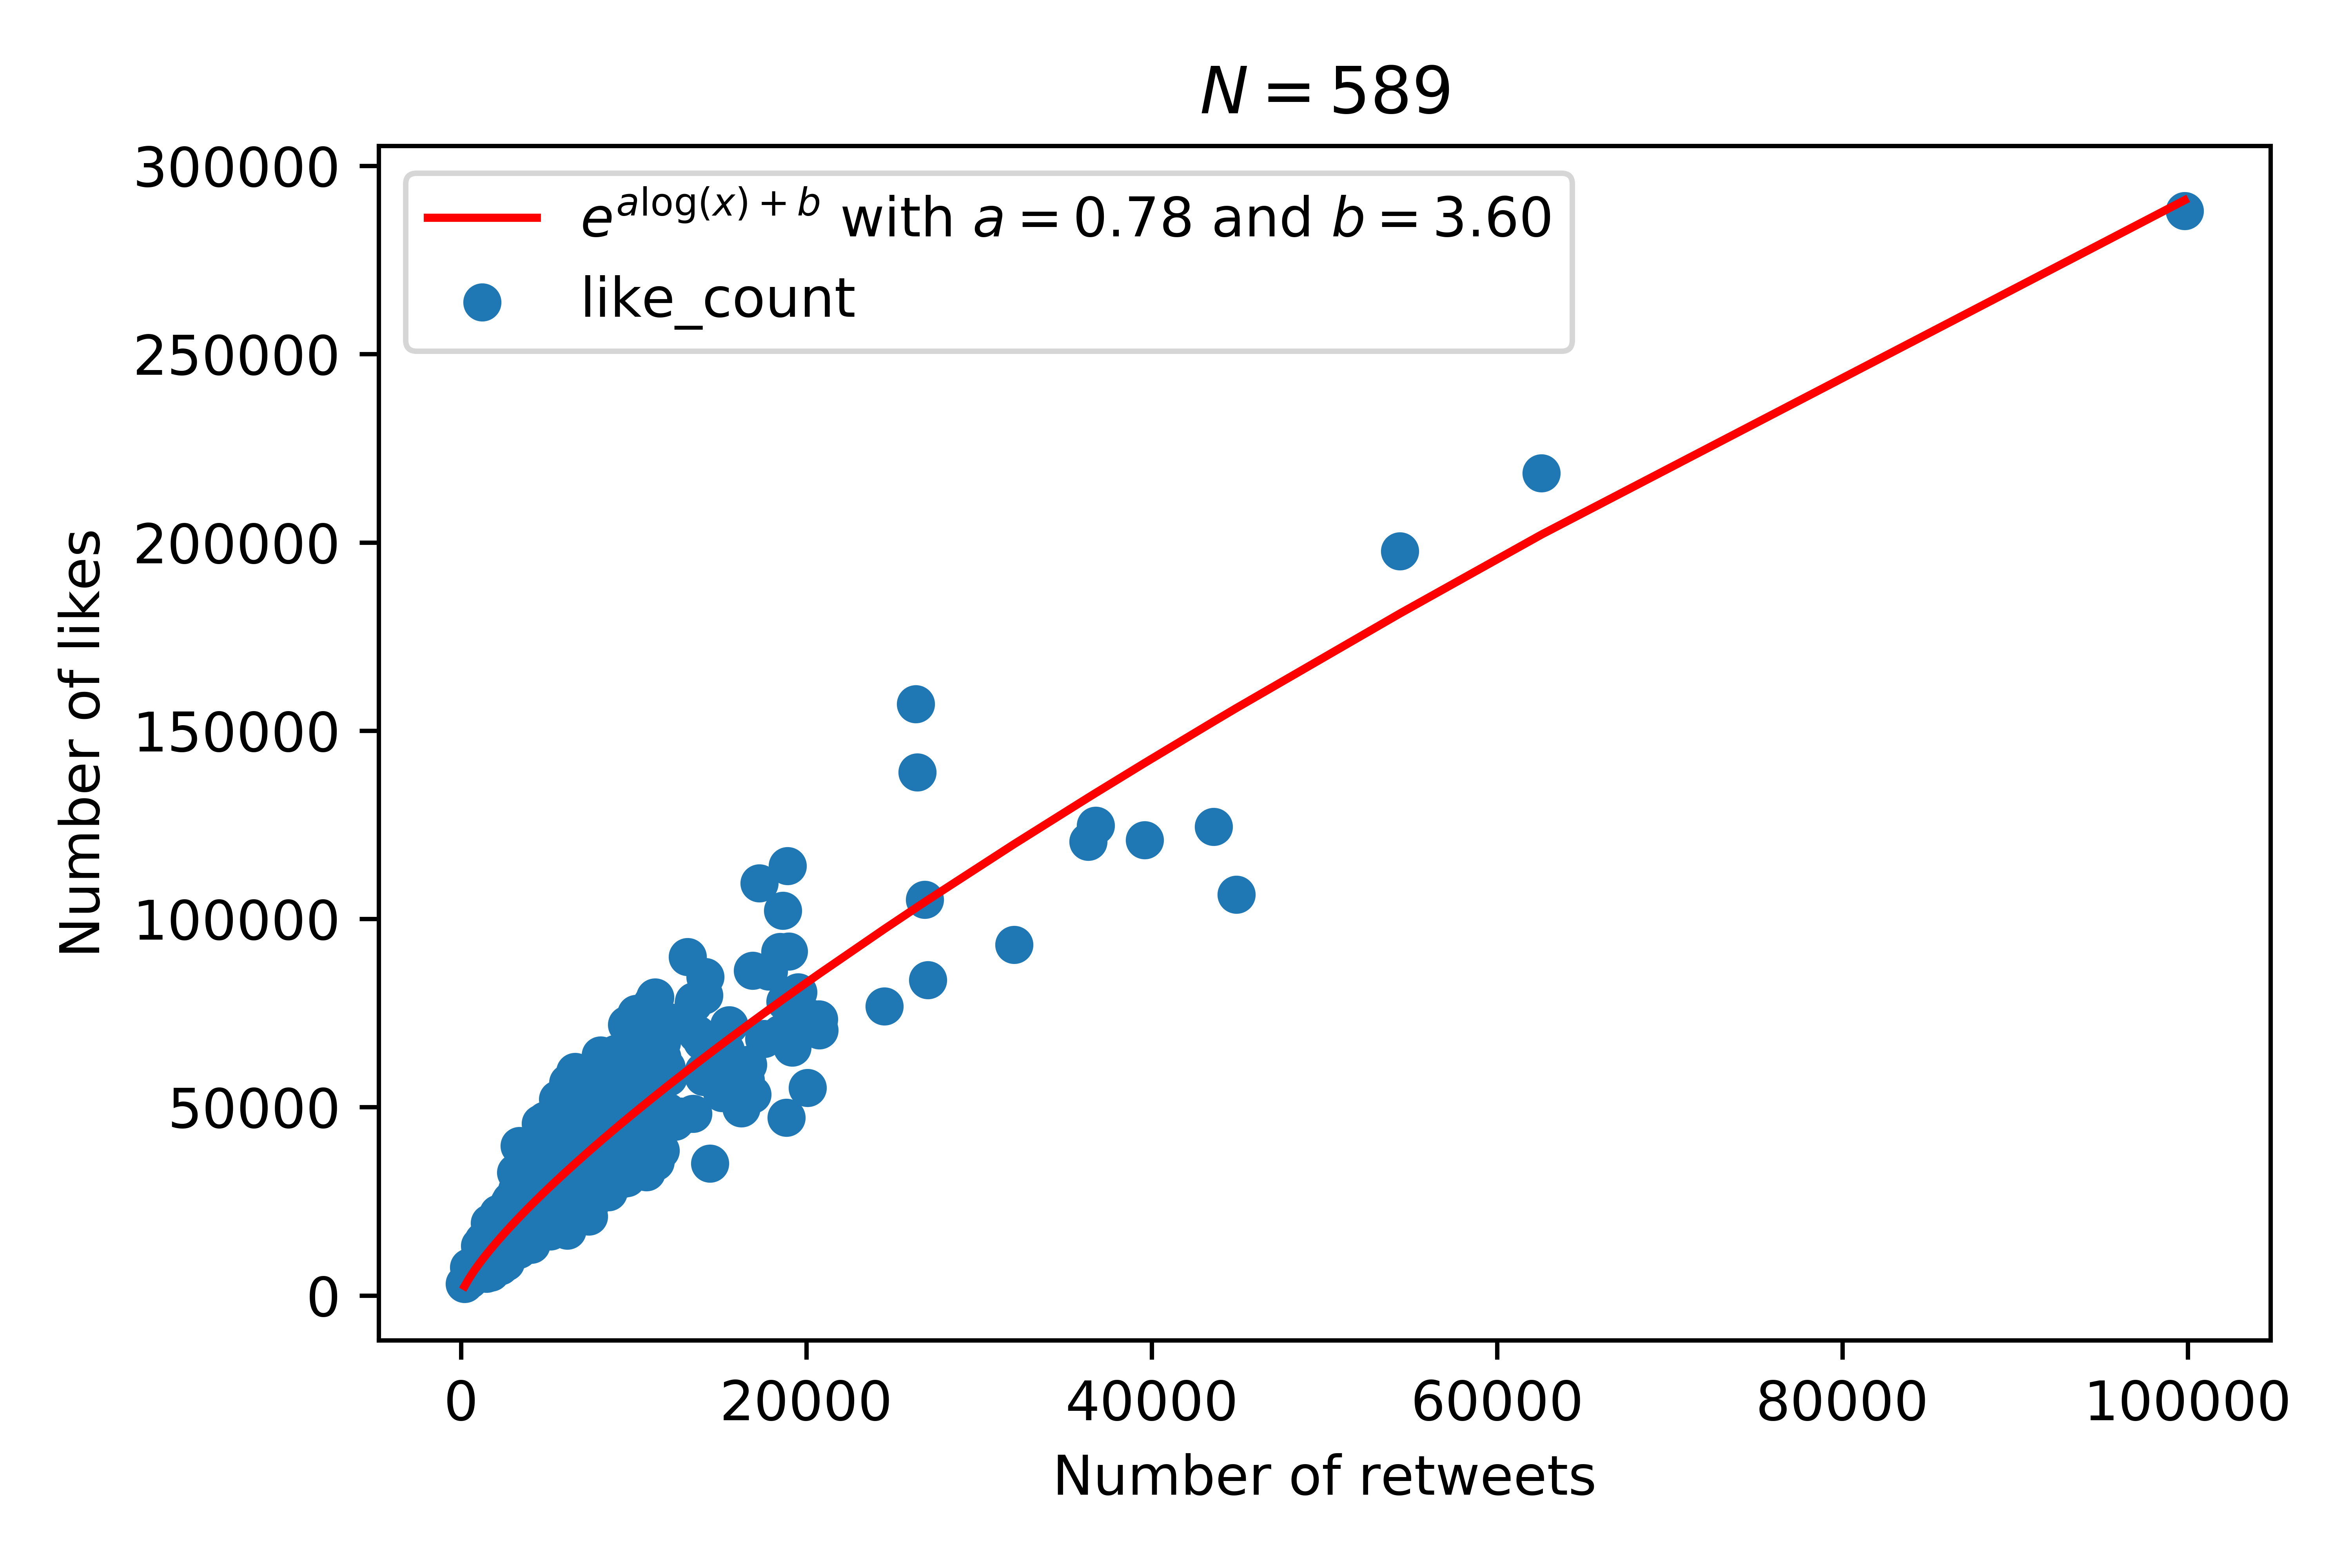
This will allow us to mainly concentrate on likes for the rest of our analysis. (We could have just as arbitrarily chosen retweets.)
How do likes change over time
If we take a look at the number of likes of each tweet over time we see that there is an increasing trend:
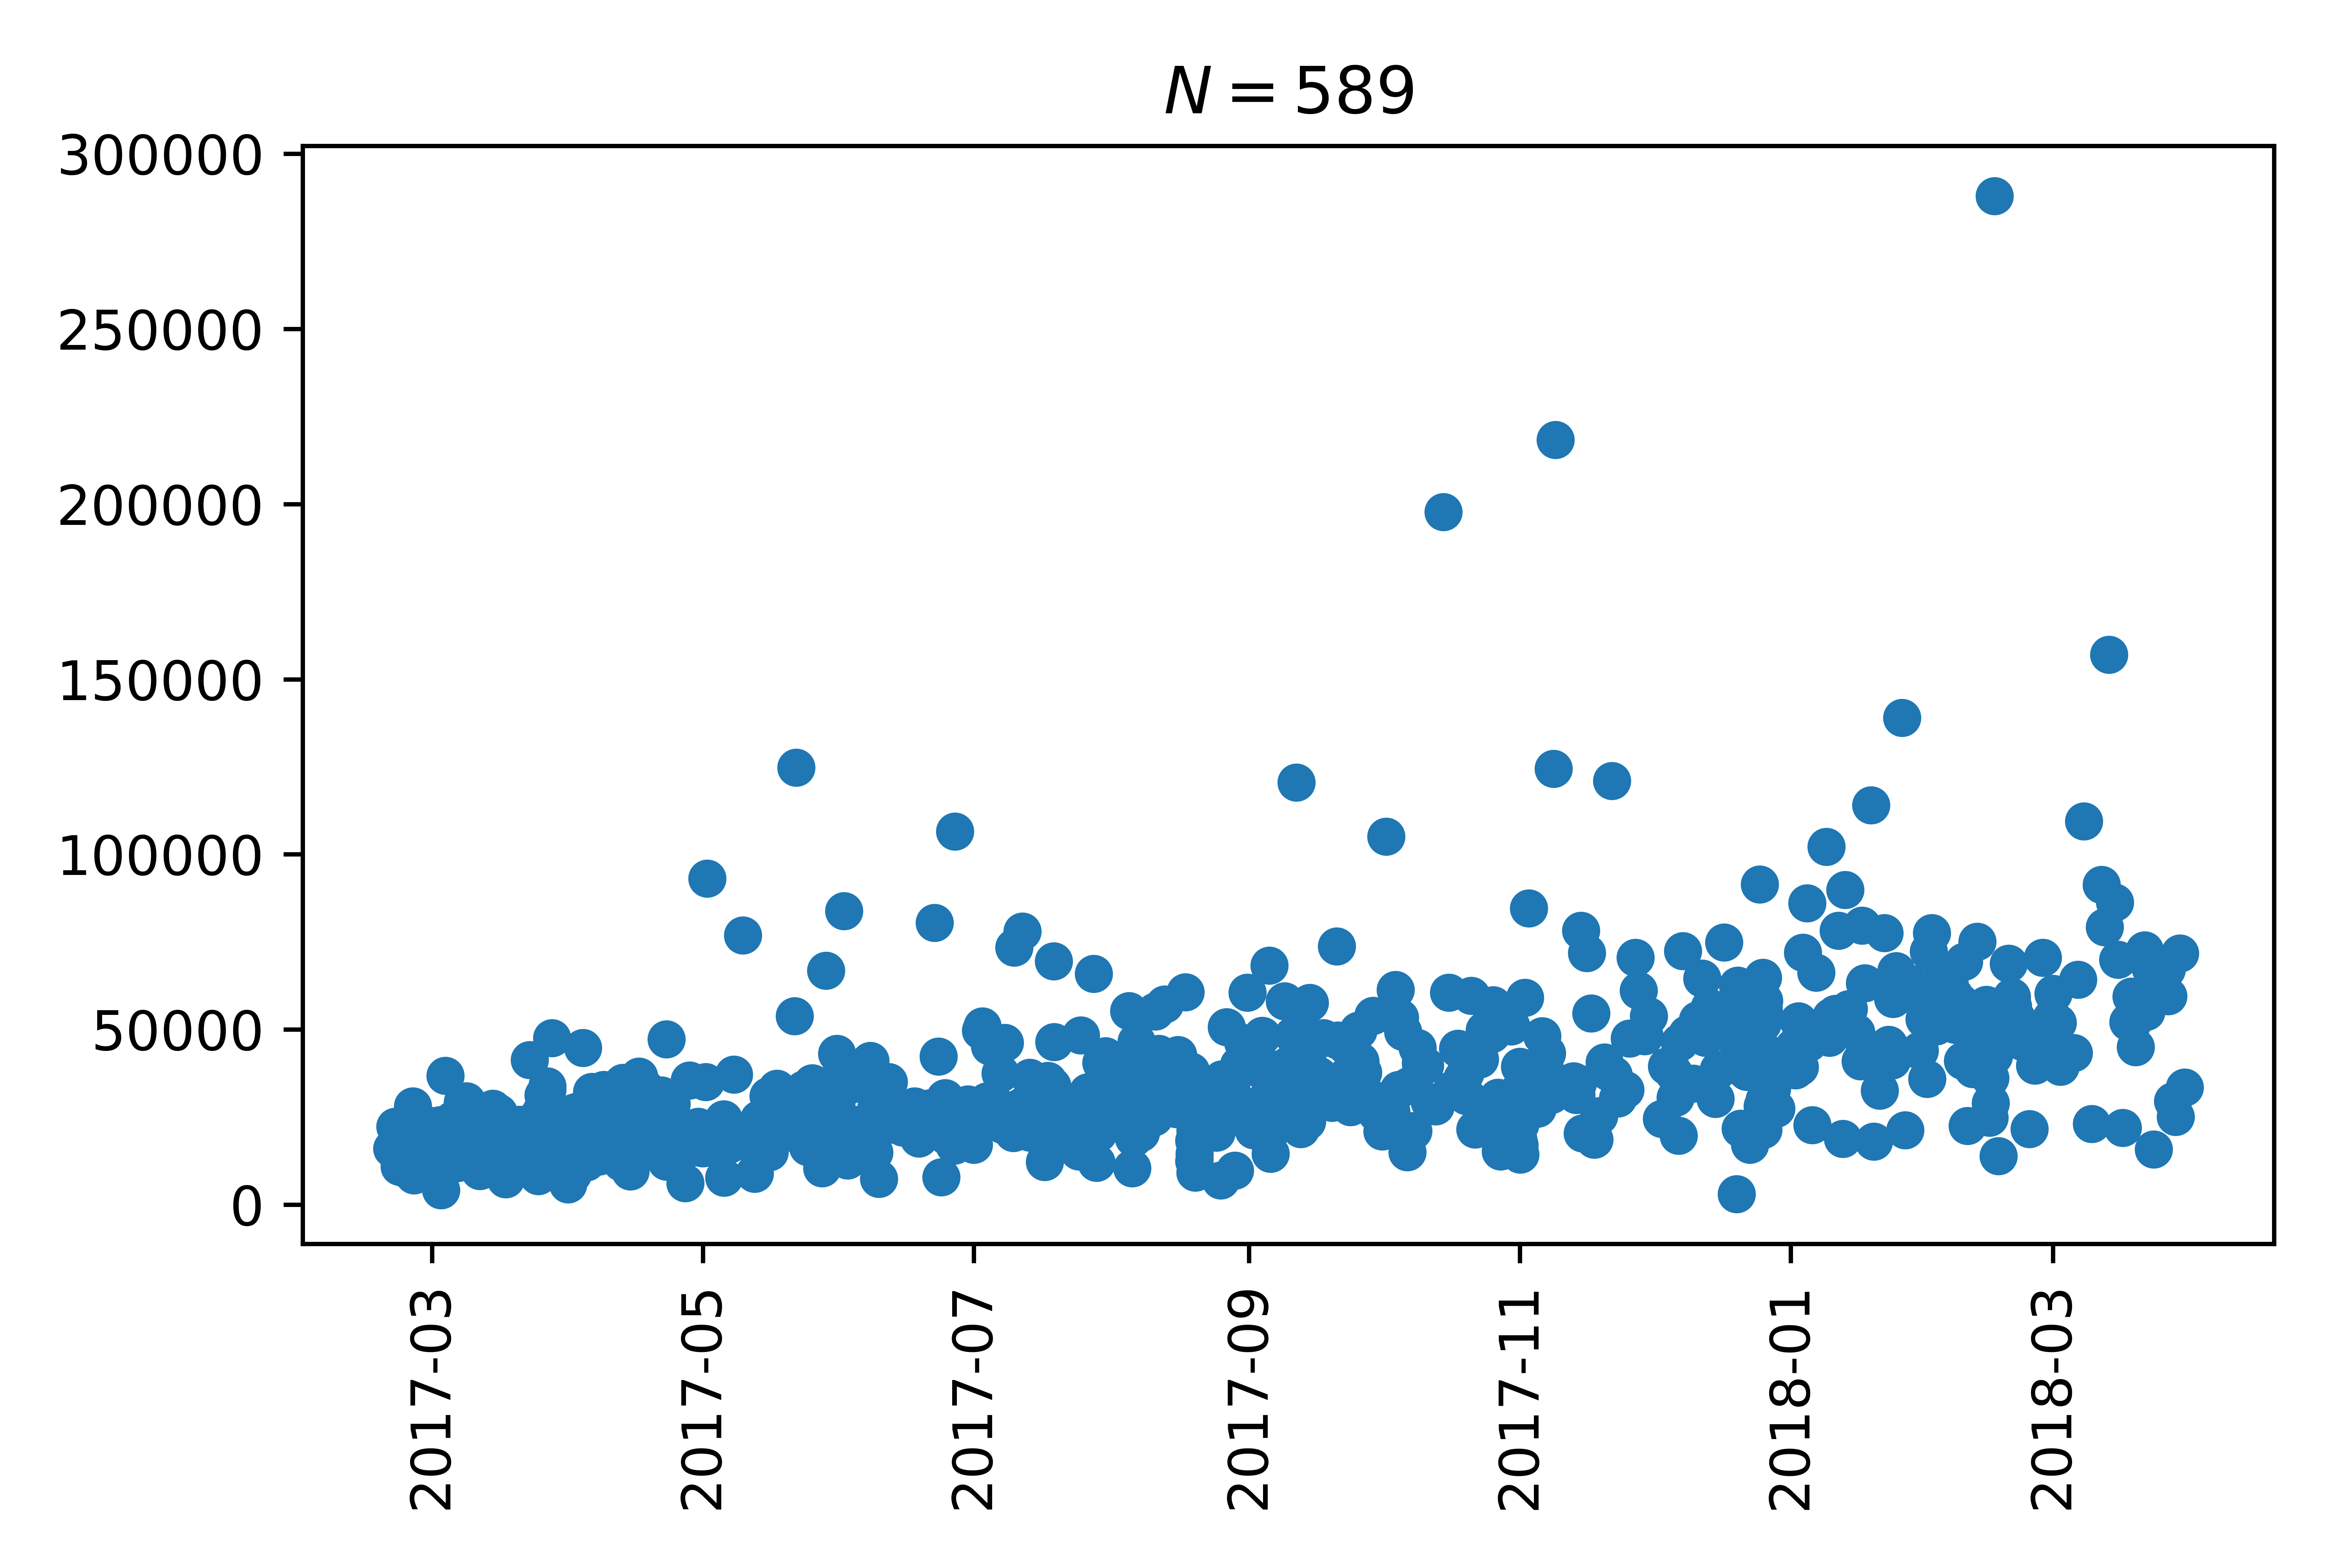
I suspect that this is linked to the growth in followers (and potentially users of twitter) over time.
To correct for this we’ll fit a trend line to our data:
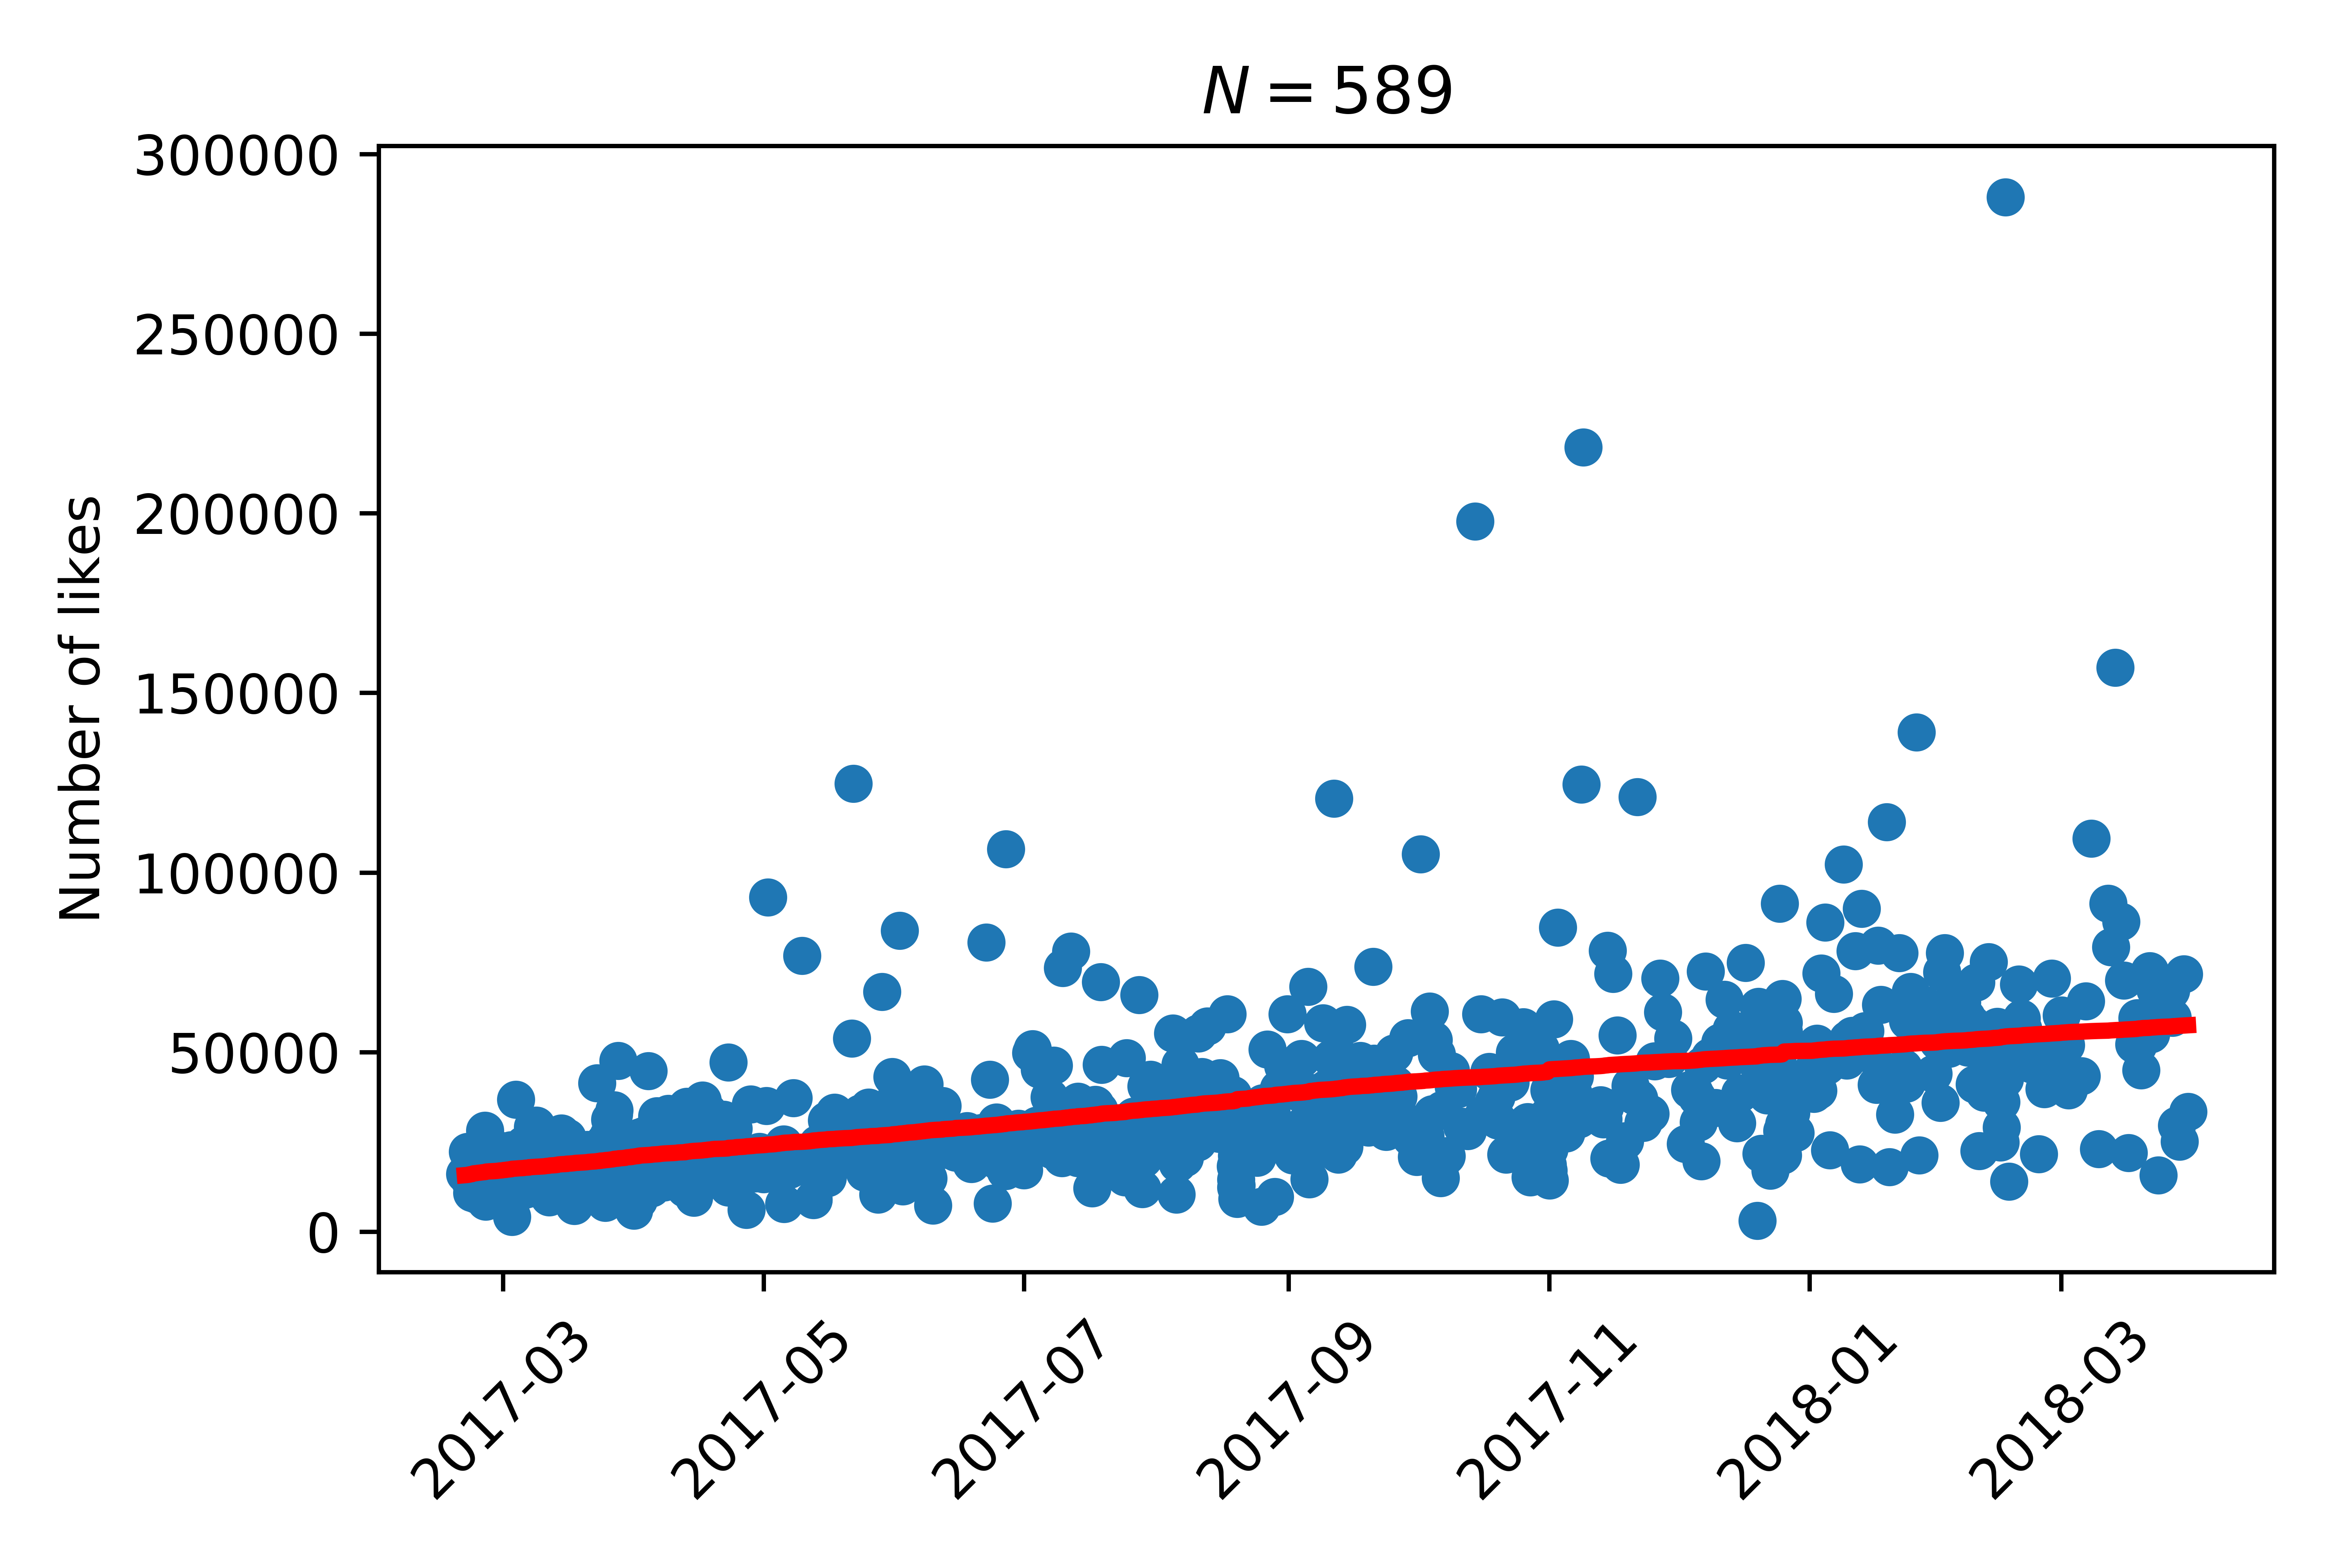
Once we have done that we will now only consider the detrended number of likes, ie the difference of the number of likes the tweet got with the trend. So, if a tweet has a positive detrended count that implies the doggo got more than expected.
So we can, for example take a look at how the time of the day affects things:
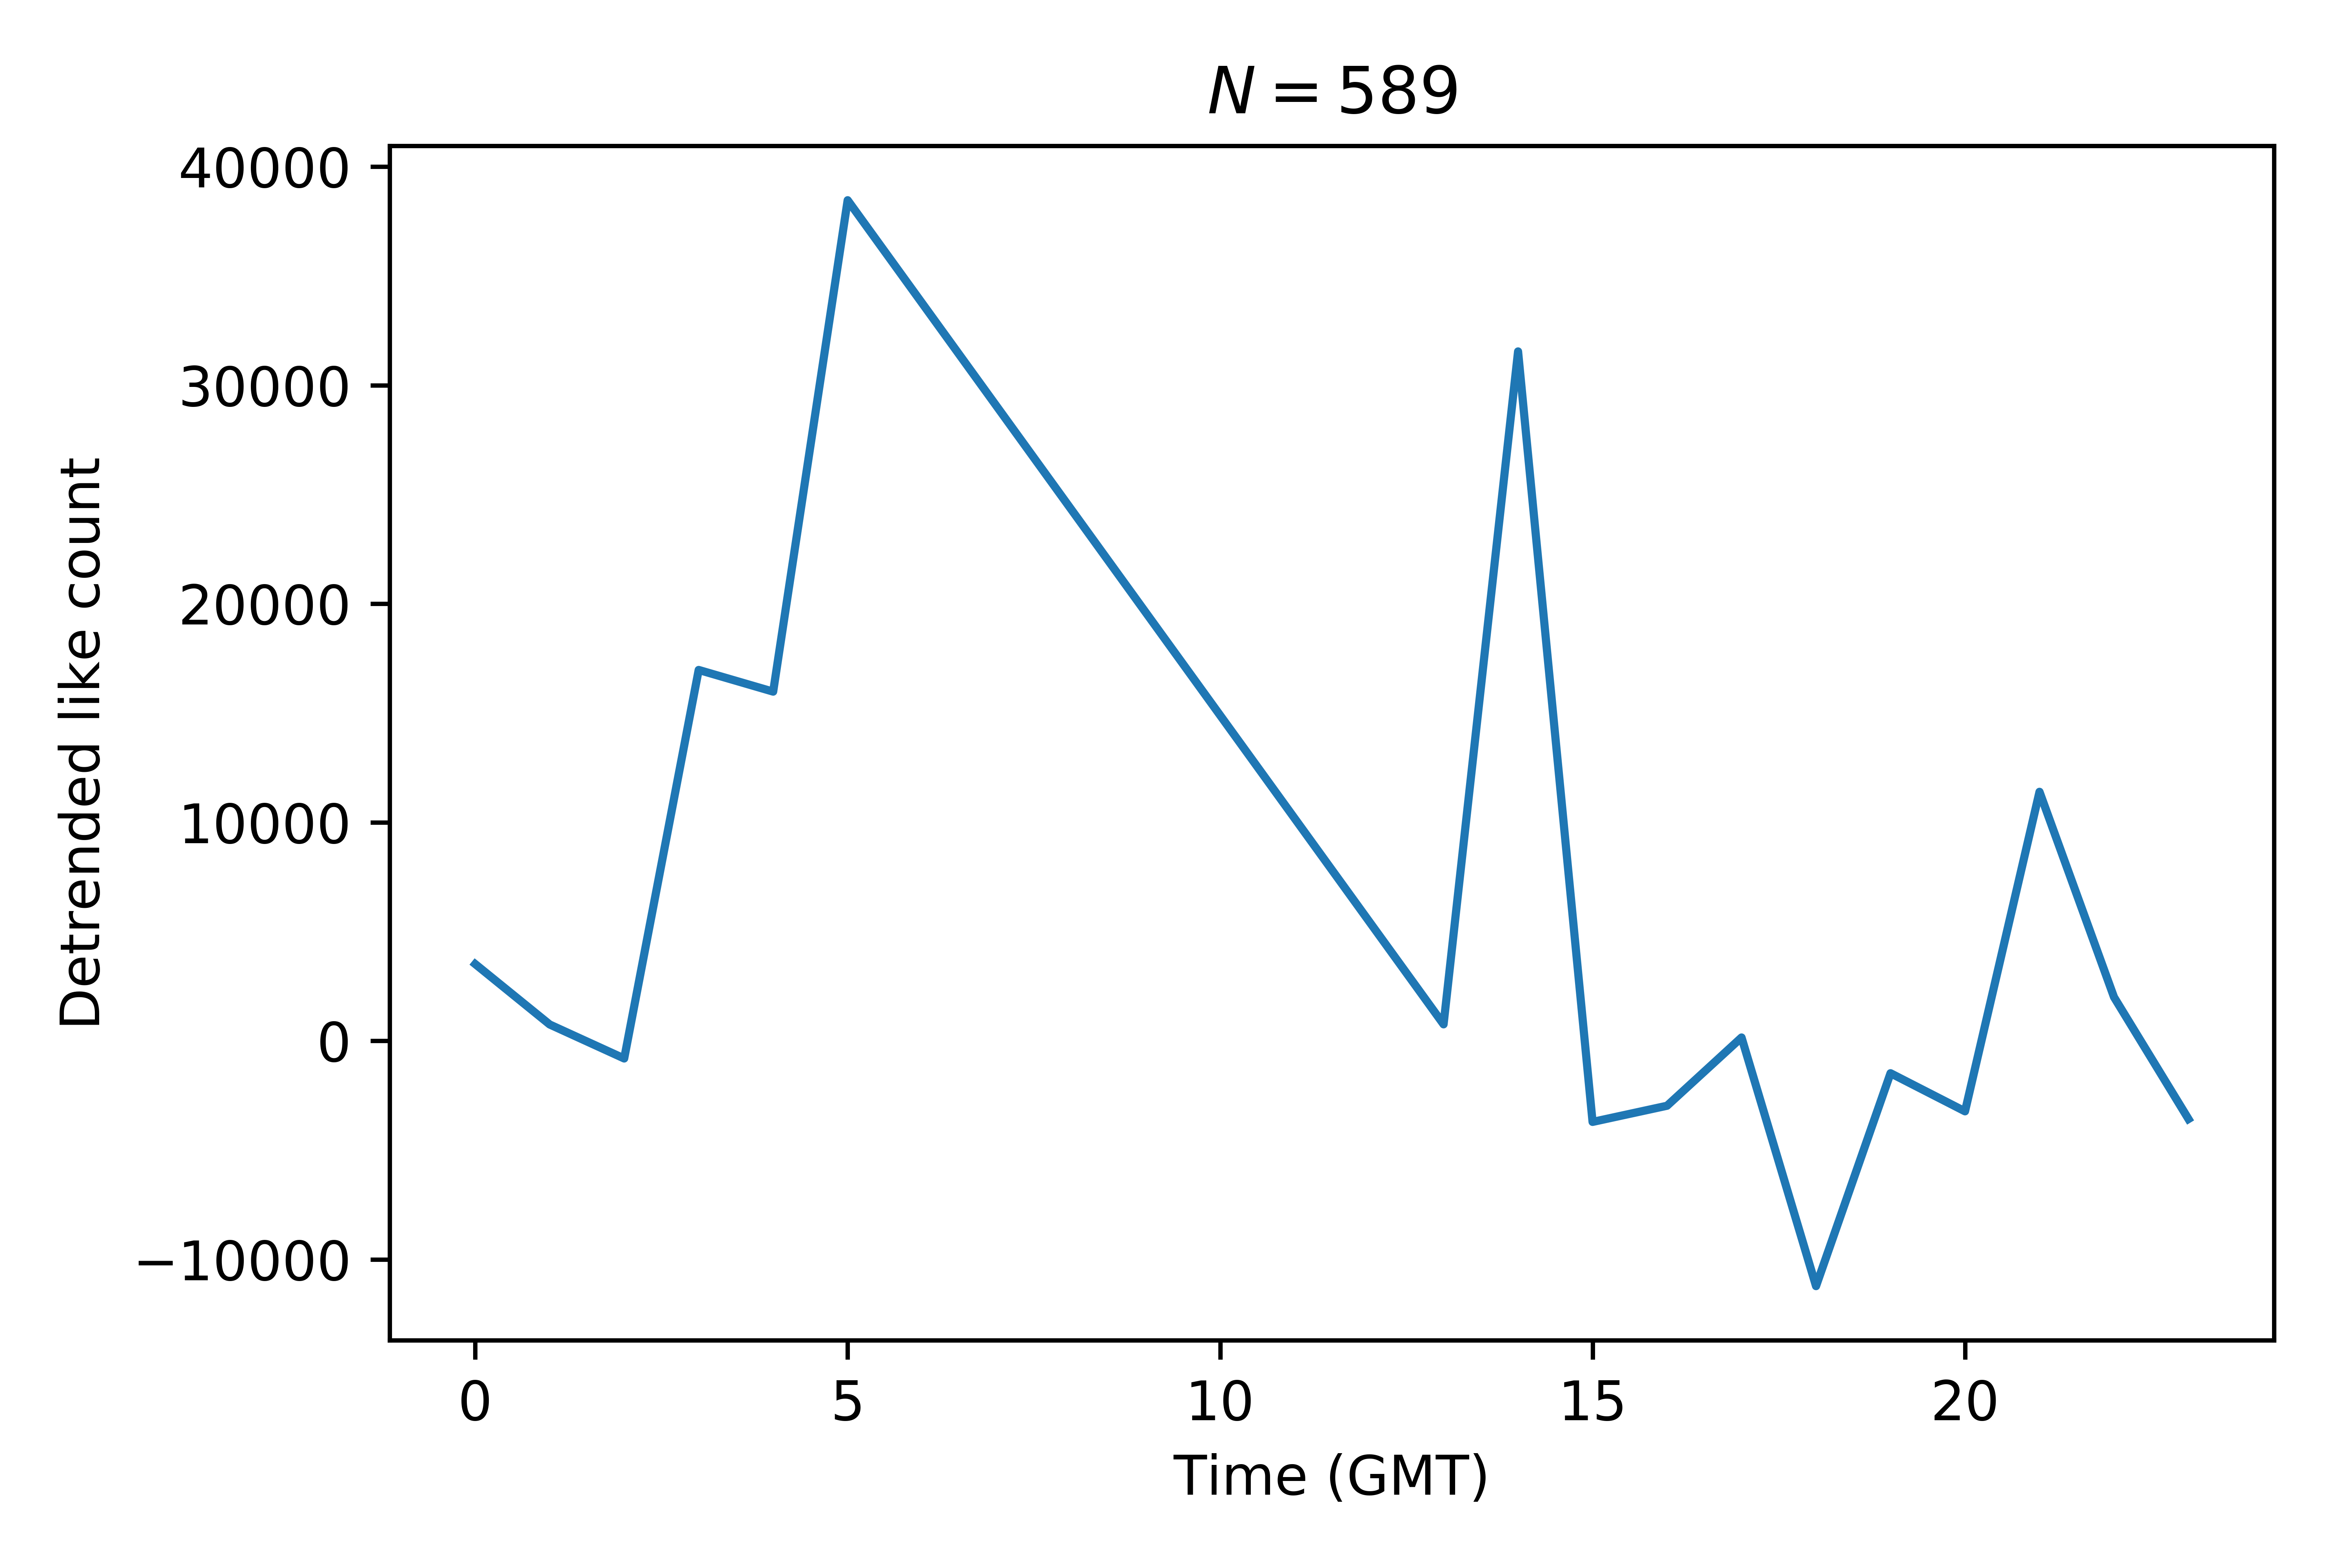
We see that doggos posted at 5am GMT seem to get the most likes.
Also, it’s not great to be a doggo posted on a Friday apparently (poor doggos):
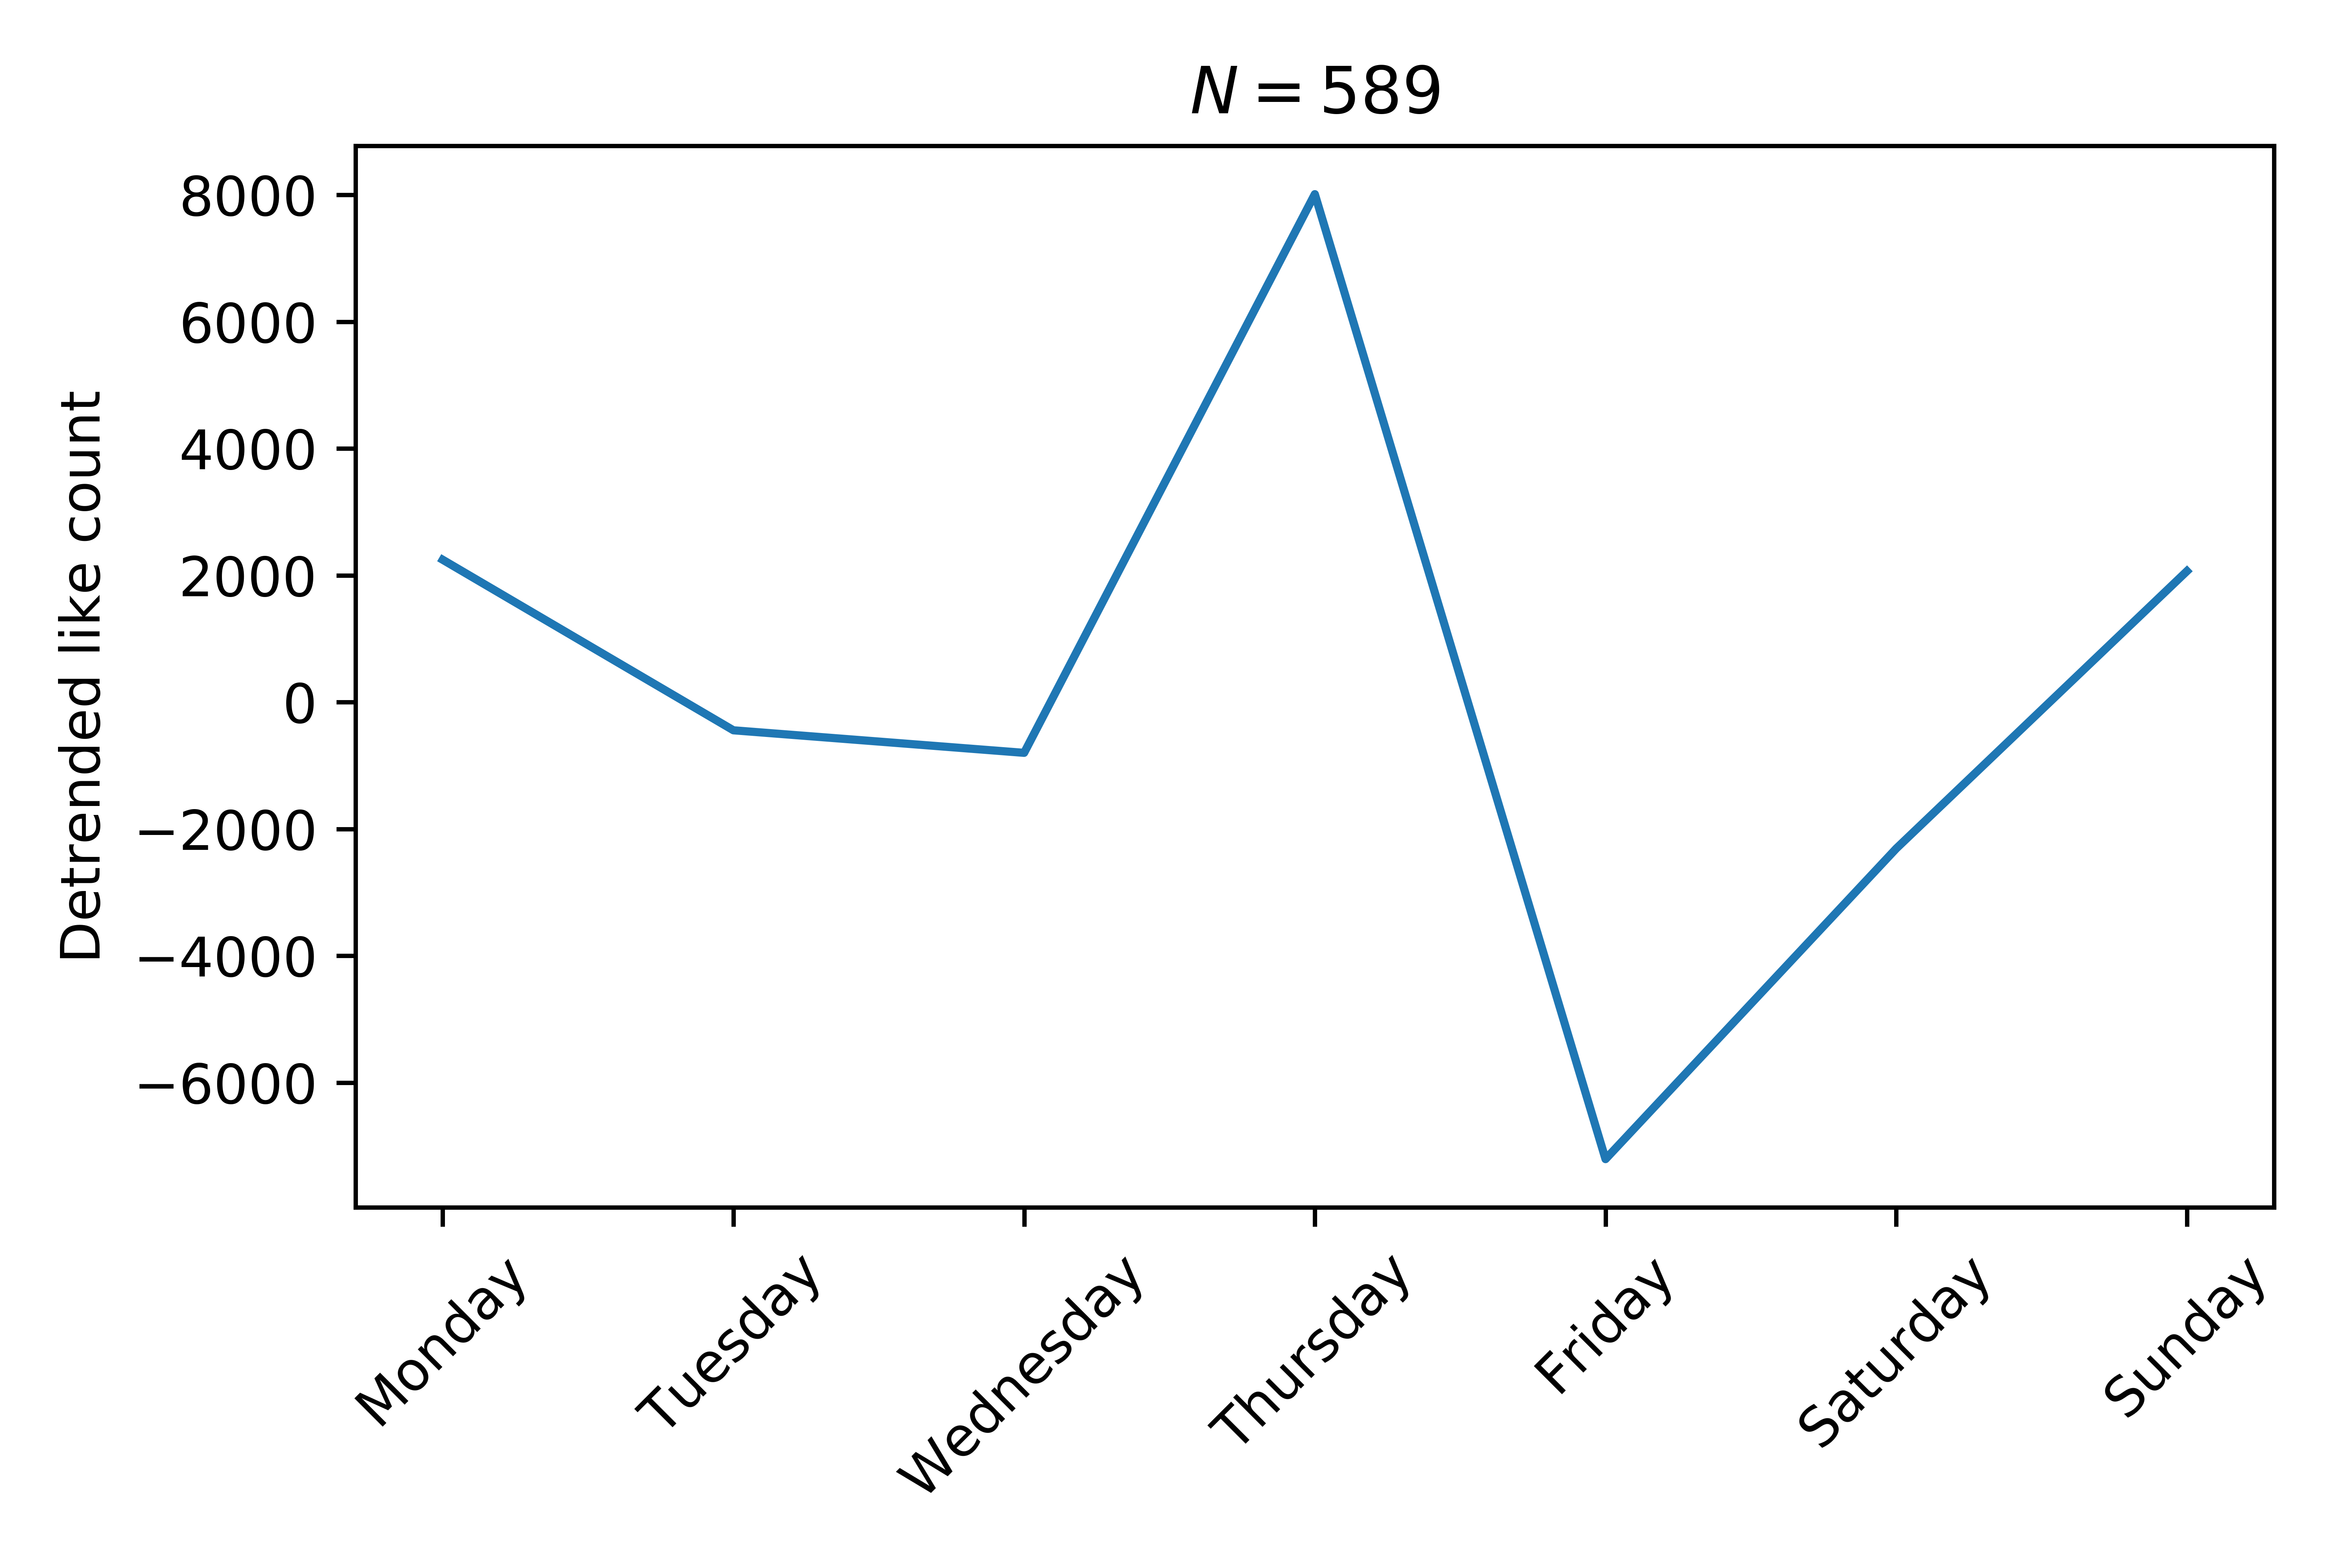
This is only slightly insightful, there will always be better and/or worse times of the day to post things.
What I really want to know is: does the work done by @dog_rates (writing the tweet and scoring the doggos) advantage some doggos over others in terms of the likes they receive?
The effect of score
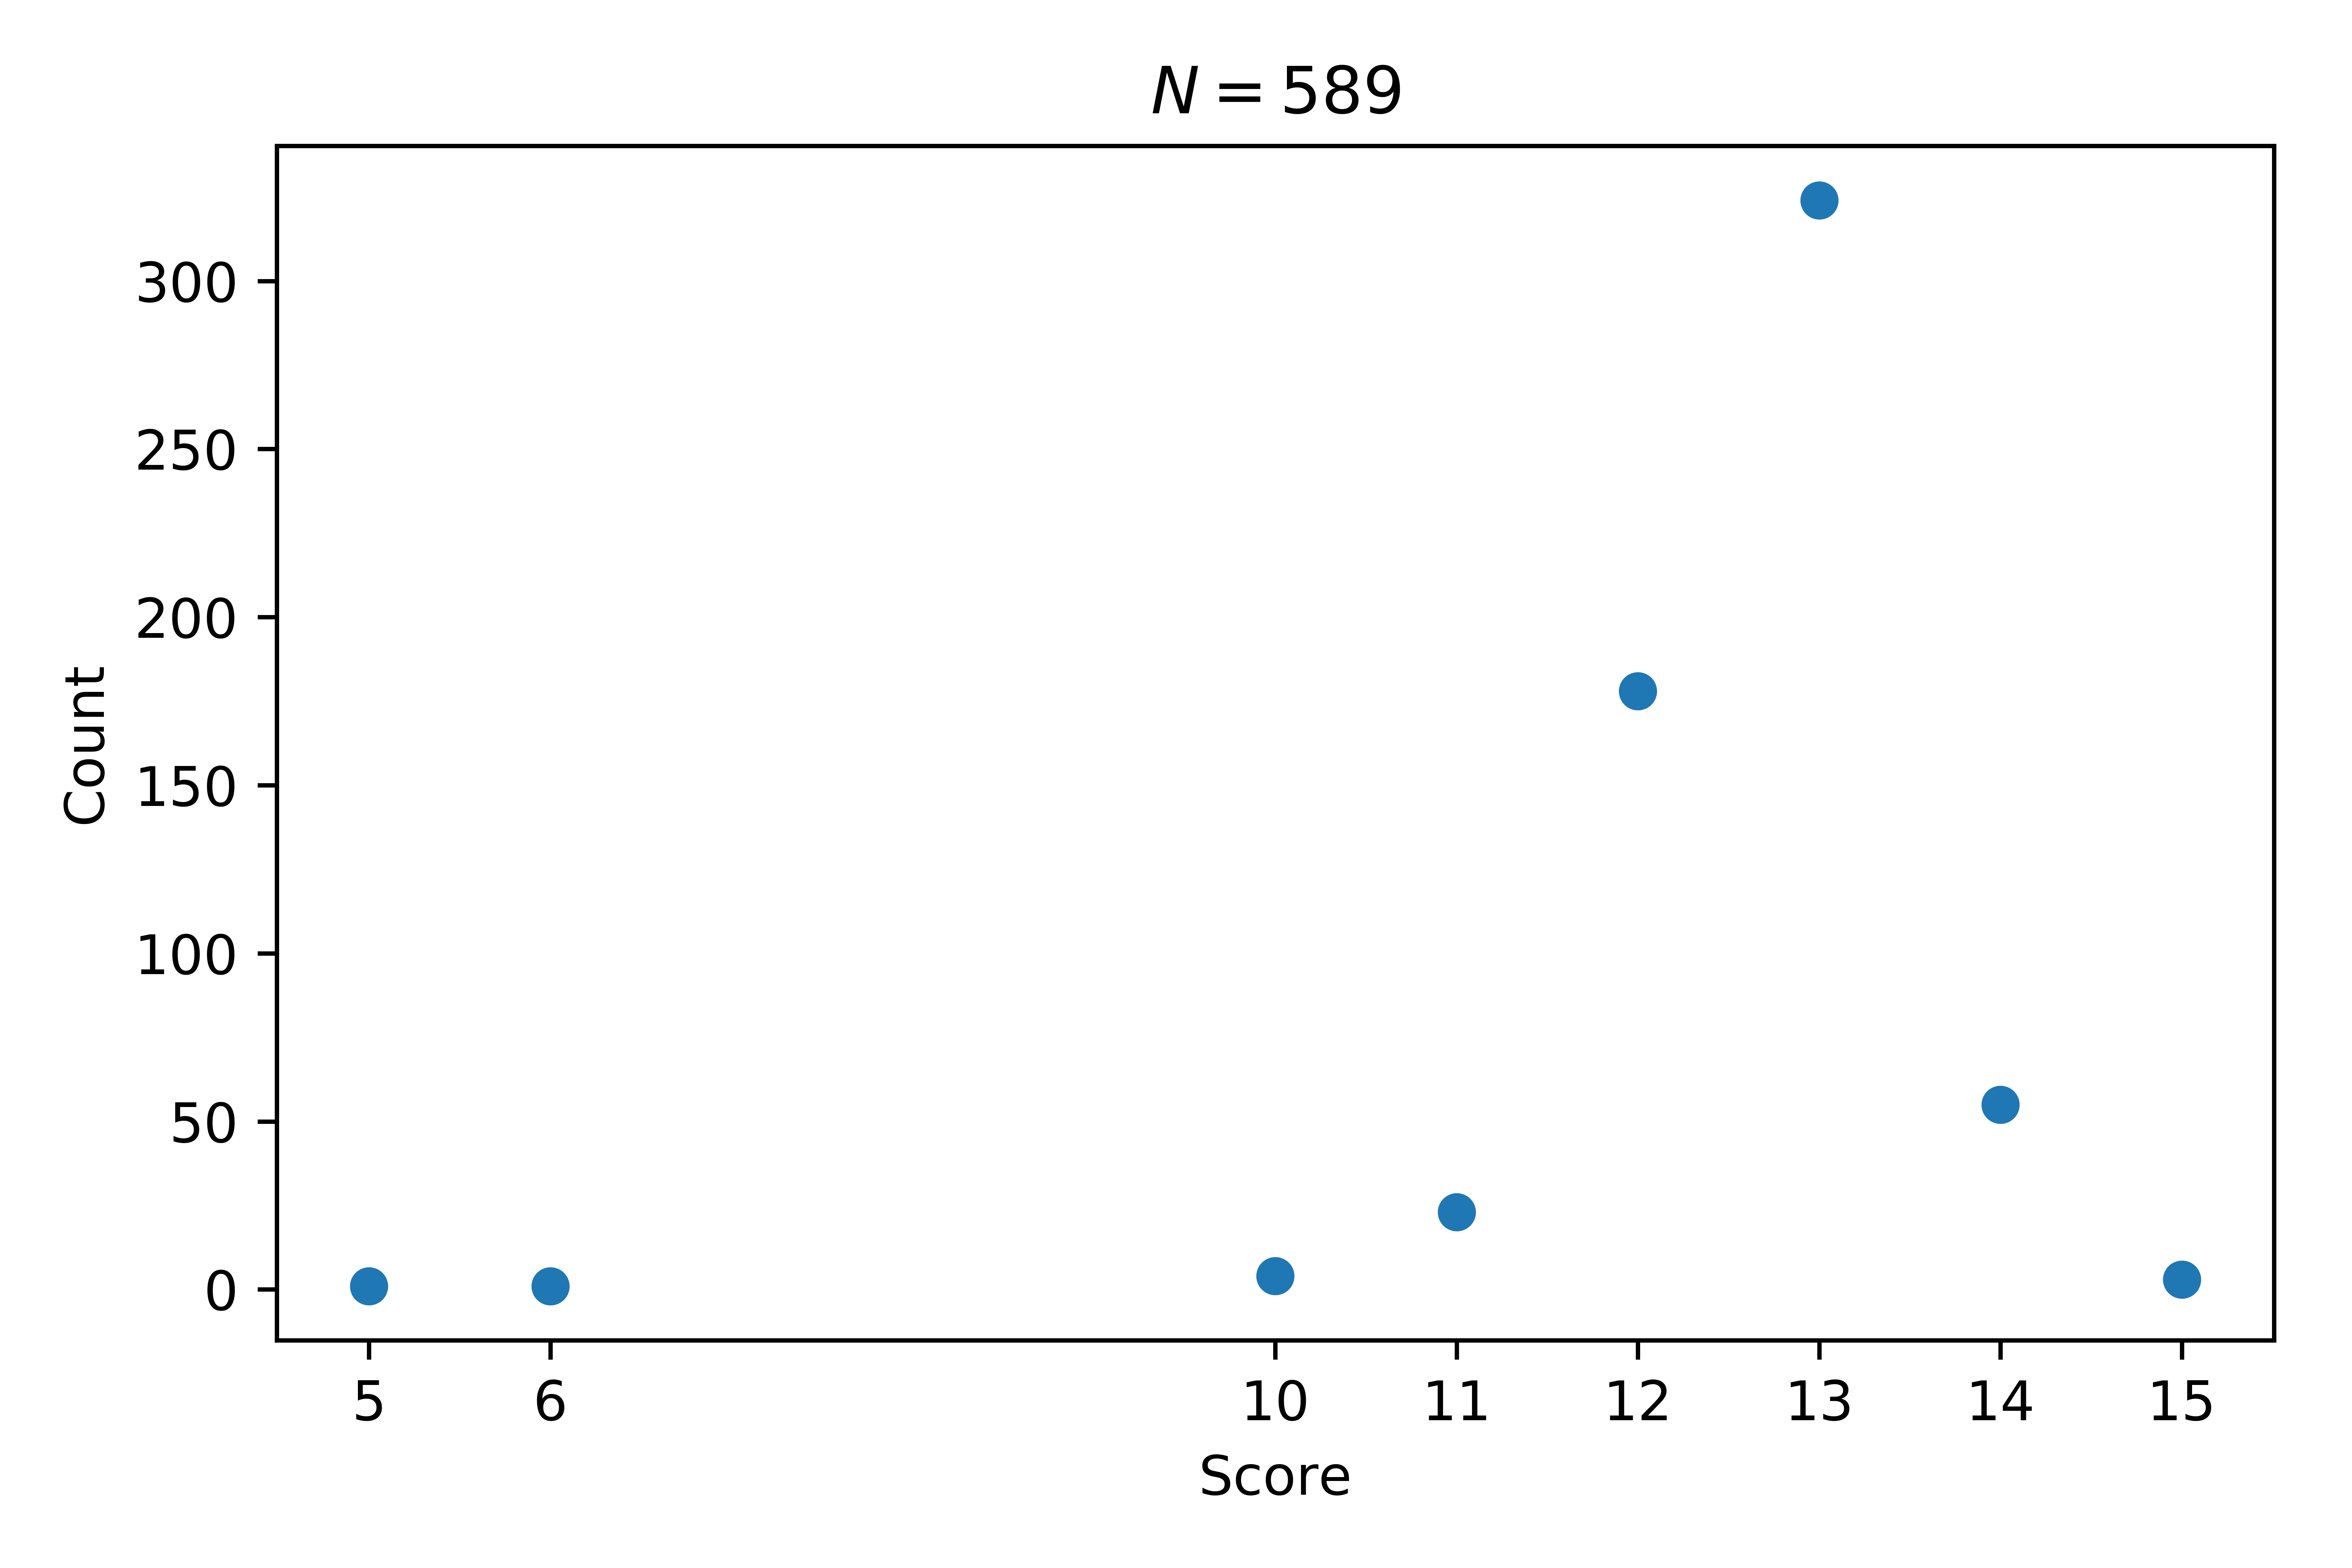
Looking at the number of doggos given each rating we see that \(15/10\) is very rare and that most doggos are a \(13/10\).
Let us see how this affects the likes:
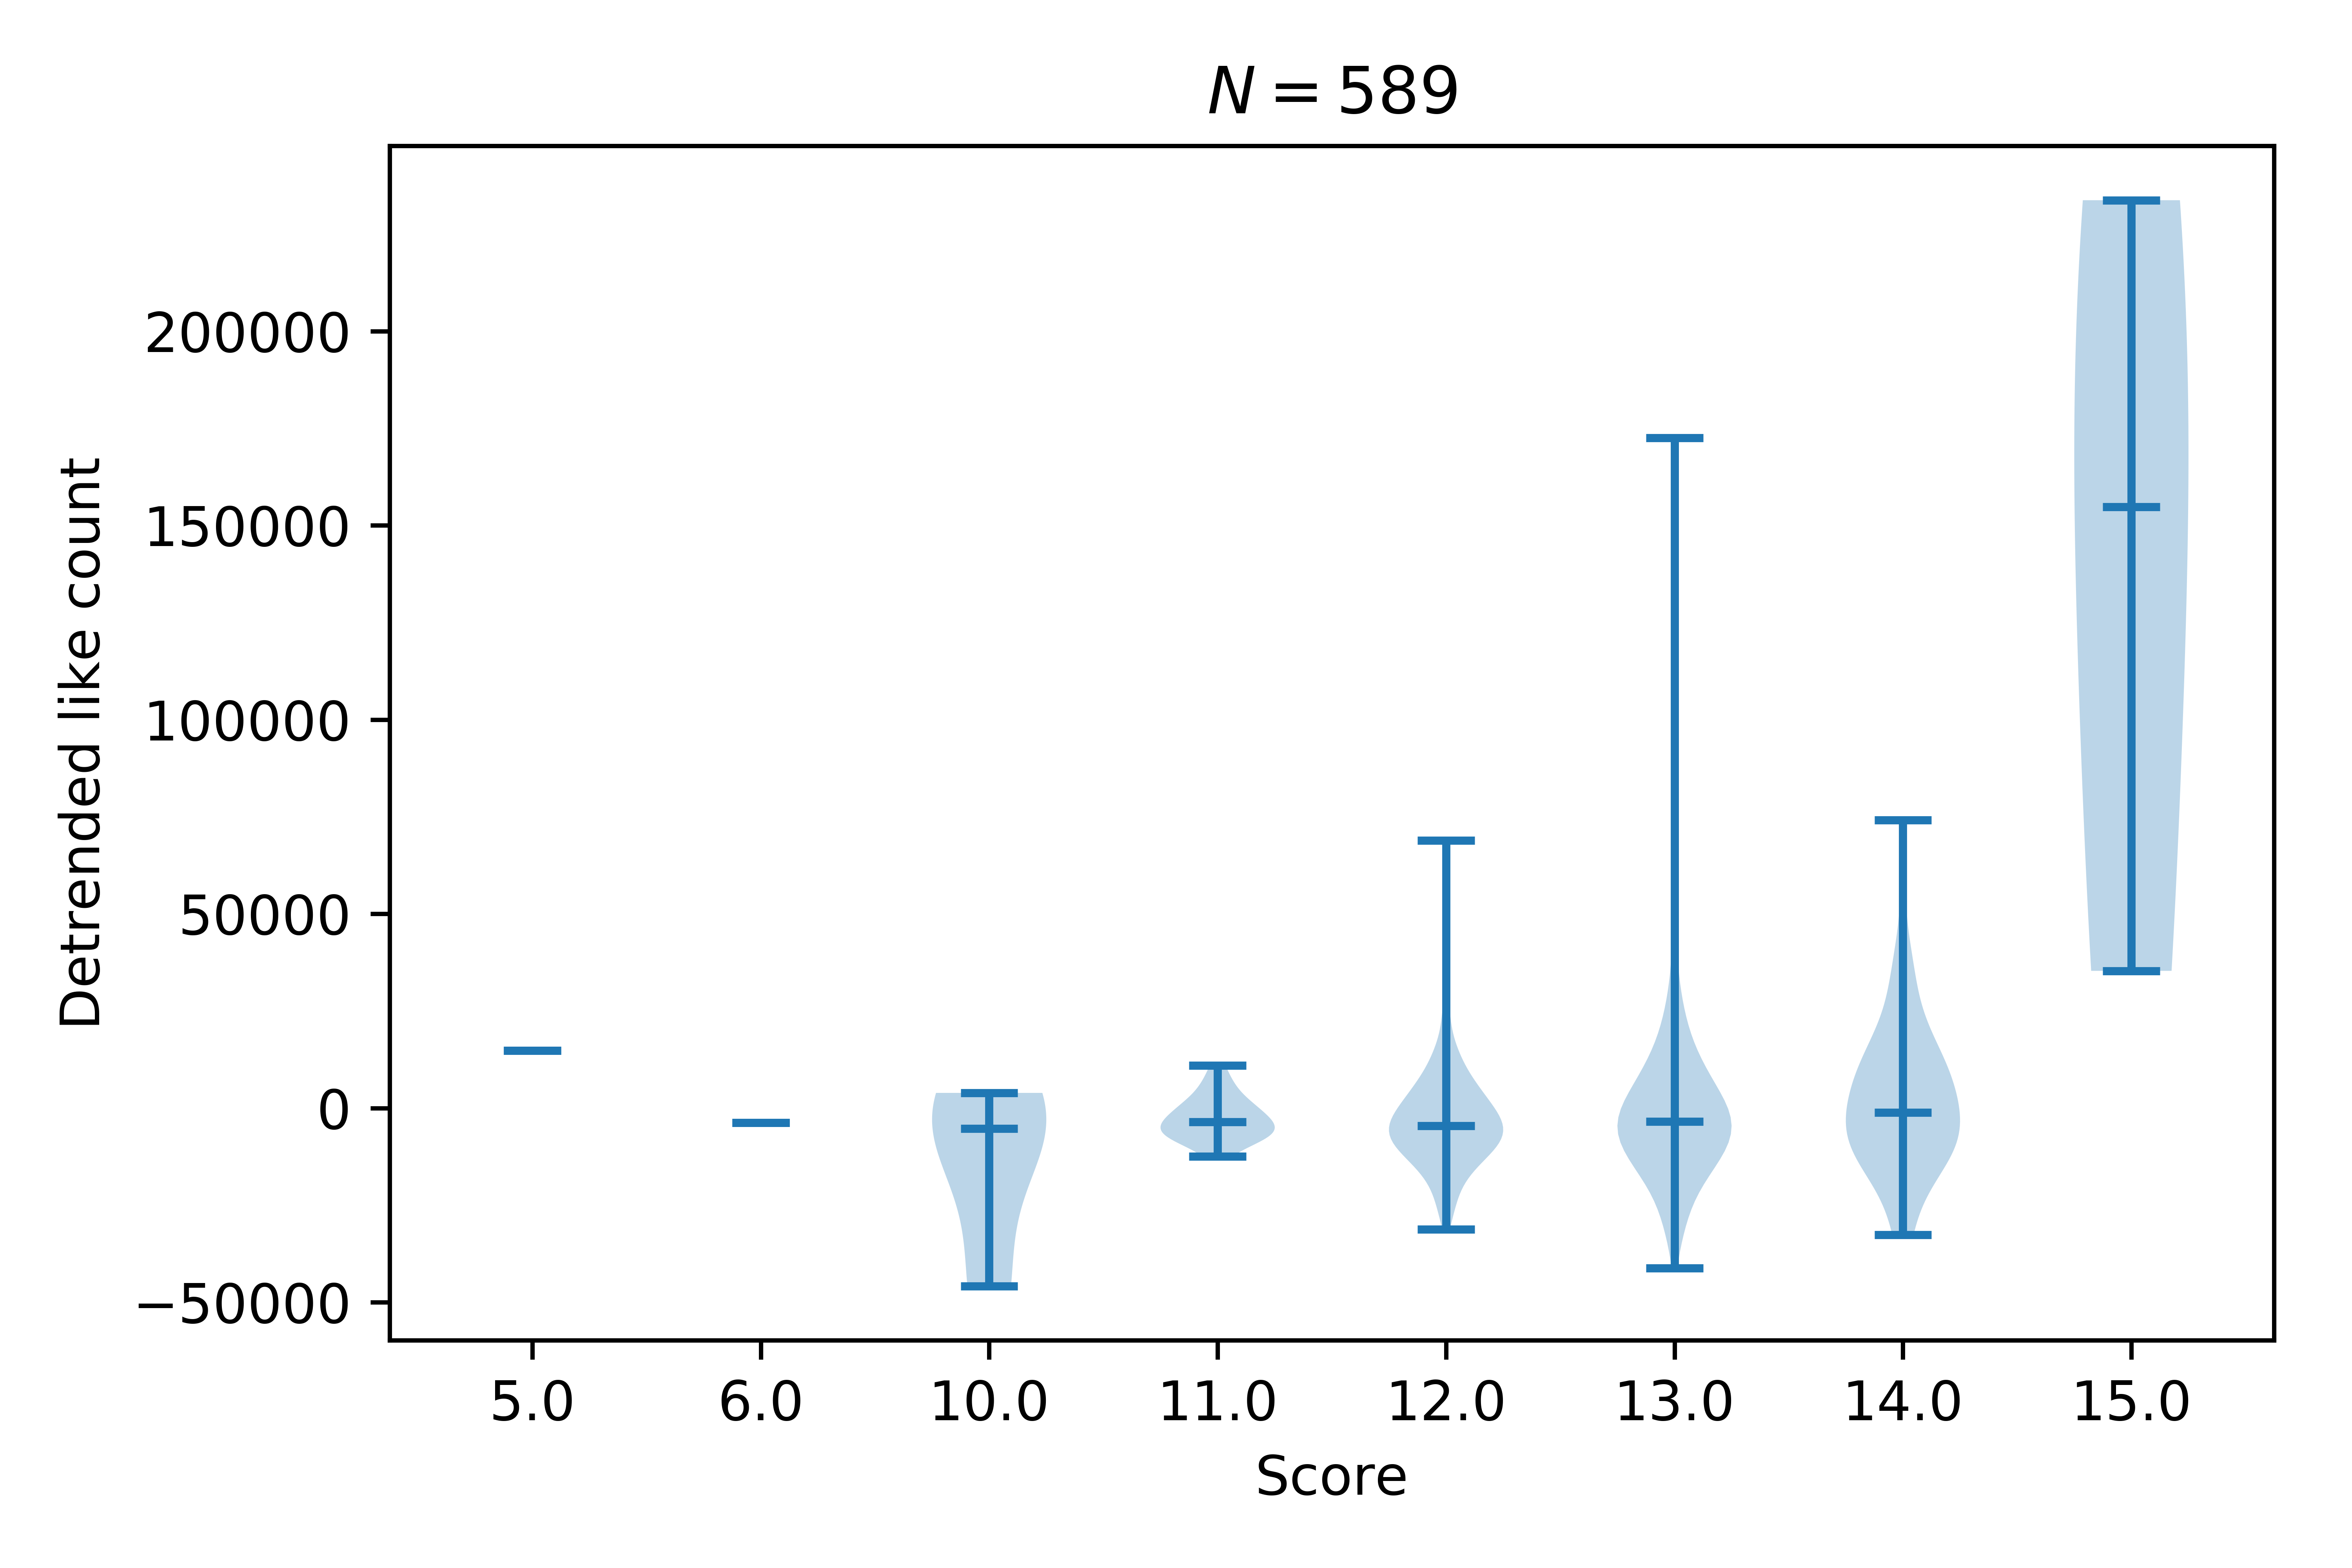
That plot shows the variation of the number of (detrended) likes for each group of scores. The small horizontal line shows an average (the median). It’s clear that 15/10 gets a higher average than all other doggos (they are probably very very good doggos) but what about the range from 11/10 to 14/10?
If we just consider those ratings and perform a statistical test called analysis of variance or ANOVA we actually THANKFULLY see that there is no (statistically significant) difference between how liked the doggos are based on their score.
There is other analysis that could be carried out but frankly I feel embarrassed for doubting the expertise of @dog_rates: they are a professional high quality dog rating service and I should have known that any analysis of the data would only confirm this.
Summary
This involved a few things:
- Grabbing the tweets using the Tweepy library.
- Cleaning and extracting further data using the Pandas library.
- Analysing things using statistical methods and visualisation:
- statsmodels
- sklearn
- matplotlib
- even some sympy to solve an equation.
You can find the code here: github.com/drvinceknight/DataScienceingDogRates
PS
If by any weird way @dog_rates happens to read this, I would not have been able to do this without Riggins, he’s a very good dog and helped tremendously. (Always tries his best.)


EDITS
Here’s a tweet showing links to some other cool analysis done on @dog_rates:
🐕 important @dog_rates #DataScience posts:
— Luis D. Verde (@LuisDVerde) March 28, 2018
🐾 relationship between likes/RTs and ratings, by @drvinceknight https://t.co/iDg3j4inzz
🐾 relationship between ratings and dog names, by mehttps://t.co/GaEITaDoqA
🐾 ratings through time, by @dhmontgomery
https://t.co/E0sIe2Tka6
@dog_rates pointed out that the reason for the Friday dip is that those are usually doggos that need a bit more help and support. Be sure to signal boost as much as possible!:
i can offer some insight into the peculiarities you found. for example: Friday posts are gofundme’s and include a link in the tweet, resulting in a significant decrease in RTs/likes
— WeRateDogs™ (@dog_rates) March 28, 2018