Sold: A Python library for the study of Acutions
I have been playing around with auction theory, I put sold together which lets you simulate auctions:
https://github.com/drvinceknight/sold
Here is some code to simulate a second pay auction where 1 of the bidders shades their bid (optimal behaviour in a first pay auction) and the other bids their true value.
import scipy.stats
import numpy as np
import matplotlib.pyplot as plt

import sold.allocate
import sold.bid
import sold.pay

N = 2
repetitions = 50_000
shade_steps = 9
shades = np.linspace(0, 1, shade_steps)
valuation_distributions = [scipy.stats.uniform for _ in range(N)]
utility = np.zeros(shape=(N, repetitions, shade_steps))

for i, shade in enumerate(shades):

    bidding_functions = [sold.bid.create_shaded_bid_map(shade), sold.bid.true_value]

    for seed in range(repetitions):
        allocation, payments, valuations = sold.auction(
            valuation_distributions=valuation_distributions,
            bidding_functions=bidding_functions,
            allocation_rule=sold.allocate.first_price,
            payment_rule=sold.pay.second_price,
            seed=seed,
        )
        utility[:, seed, i] = allocation * valuations - payments
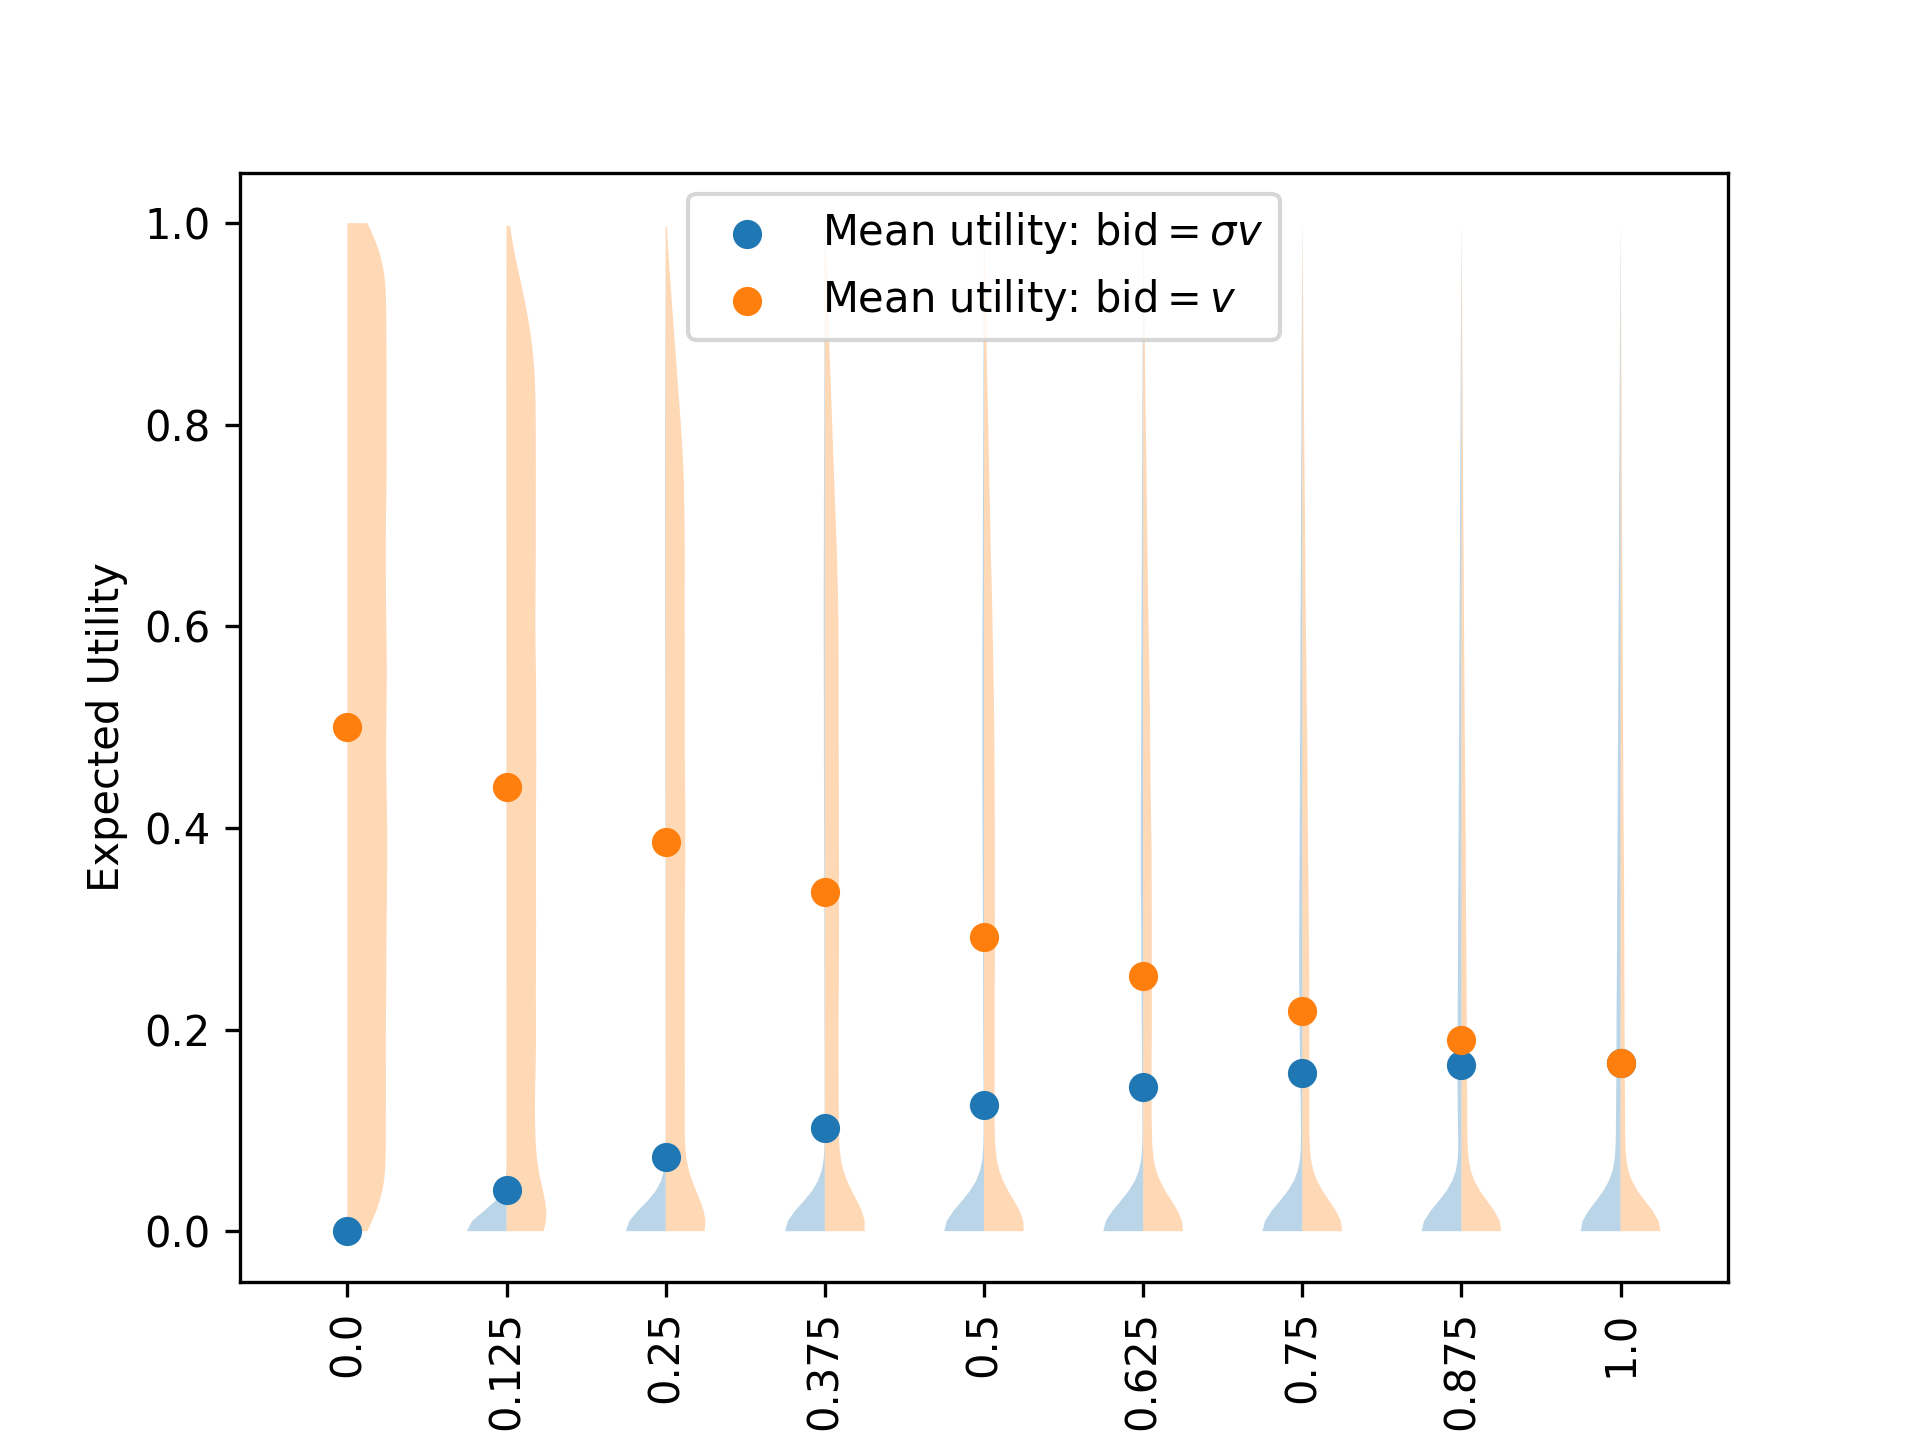
The true value is known to be weakly dominant in a second pay auction) which is kind of what is confirmed by this plot:
plt.figure()
plt.violinplot(
    utility[0],
    showmeans=False,
    showmedians=False,
    showextrema=False,
    side="low",
)
plt.violinplot(
    utility[1],
    showmeans=False,
    showmedians=False,
    showextrema=False,
    side="high",
)

plt.scatter(range(1, shade_steps + 1), np.mean(utility[0], axis=0), label=r"Mean utility: bid$=\sigma v$")
plt.scatter(range(1, shade_steps + 1), np.mean(utility[1], axis=0), label=r"Mean utility: bid$=v$")


plt.xlabel(r"Shade value $\sigma$")
plt.xticks(range(1, shade_steps + 1), shades, rotation=90)
plt.ylabel("Expected Utility")
plt.legend()
plt.show()
If anyone wants to play around with it you can python -m pip install sold or even better you can look through the code base
(I have no idea if this is something I plan to return to or just leave it as is).